“Key Informant Survey” of Production, Value, Losses and ... - DfID
“Key Informant Survey” of Production, Value, Losses and ... - DfID
“Key Informant Survey” of Production, Value, Losses and ... - DfID

You also want an ePaper? Increase the reach of your titles
YUMPU automatically turns print PDFs into web optimized ePapers that Google loves.
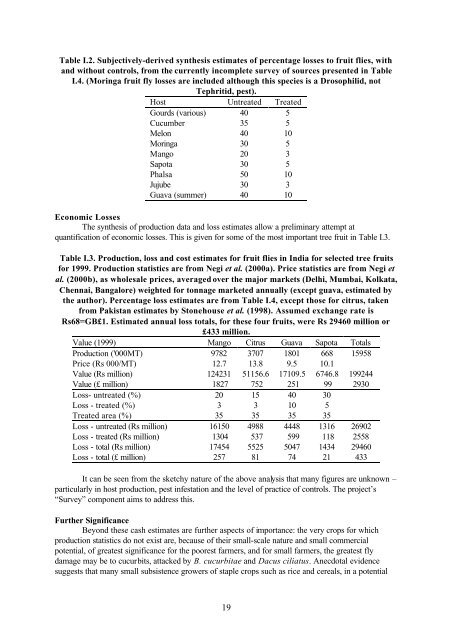
Table I.2. Subjectively-derived synthesis estimates <strong>of</strong> percentage losses to fruit flies, with<br />
<strong>and</strong> without controls, from the currently incomplete survey <strong>of</strong> sources presented in Table<br />
I.4. (Moringa fruit fly losses are included although this species is a Drosophilid, not<br />
Tephritid, pest).<br />
Host Untreated Treated<br />
Gourds (various) 40 5<br />
Cucumber 35 5<br />
Melon 40 10<br />
Moringa 30 5<br />
Mango 20 3<br />
Sapota 30 5<br />
Phalsa 50 10<br />
Jujube 30 3<br />
Guava (summer) 40 10<br />
Economic <strong>Losses</strong><br />
The synthesis <strong>of</strong> production data <strong>and</strong> loss estimates allow a preliminary attempt at<br />
quantification <strong>of</strong> economic losses. This is given for some <strong>of</strong> the most important tree fruit in Table I.3.<br />
Table I.3. <strong>Production</strong>, loss <strong>and</strong> cost estimates for fruit flies in India for selected tree fruits<br />
for 1999. <strong>Production</strong> statistics are from Negi et al. (2000a). Price statistics are from Negi et<br />
al. (2000b), as wholesale prices, averaged over the major markets (Delhi, Mumbai, Kolkata,<br />
Chennai, Bangalore) weighted for tonnage marketed annually (except guava, estimated by<br />
the author). Percentage loss estimates are from Table I.4, except those for citrus, taken<br />
from Pakistan estimates by Stonehouse et al. (1998). Assumed exchange rate is<br />
Rs68=GB£1. Estimated annual loss totals, for these four fruits, were Rs 29460 million or<br />
£433 million.<br />
<strong>Value</strong> (1999) Mango Citrus Guava Sapota Totals<br />
<strong>Production</strong> ('000MT) 9782 3707 1801 668 15958<br />
Price (Rs 000/MT) 12.7 13.8 9.5 10.1<br />
<strong>Value</strong> (Rs million) 124231 51156.6 17109.5 6746.8 199244<br />
<strong>Value</strong> (£ million) 1827 752 251 99 2930<br />
Loss- untreated (%) 20 15 40 30<br />
Loss - treated (%) 3 3 10 5<br />
Treated area (%) 35 35 35 35<br />
Loss - untreated (Rs million) 16150 4988 4448 1316 26902<br />
Loss - treated (Rs million) 1304 537 599 118 2558<br />
Loss - total (Rs million) 17454 5525 5047 1434 29460<br />
Loss - total (£ million) 257 81 74 21 433<br />
It can be seen from the sketchy nature <strong>of</strong> the above analysis that many figures are unknown –<br />
particularly in host production, pest infestation <strong>and</strong> the level <strong>of</strong> practice <strong>of</strong> controls. The project’s<br />
“<strong>Survey”</strong> component aims to address this.<br />
Further Significance<br />
Beyond these cash estimates are further aspects <strong>of</strong> importance: the very crops for which<br />
production statistics do not exist are, because <strong>of</strong> their small-scale nature <strong>and</strong> small commercial<br />
potential, <strong>of</strong> greatest significance for the poorest farmers, <strong>and</strong> for small farmers, the greatest fly<br />
damage may be to cucurbits, attacked by B. cucurbitae <strong>and</strong> Dacus ciliatus. Anecdotal evidence<br />
suggests that many small subsistence growers <strong>of</strong> staple crops such as rice <strong>and</strong> cereals, in a potential<br />
19