“Key Informant Survey” of Production, Value, Losses and ... - DfID
“Key Informant Survey” of Production, Value, Losses and ... - DfID
“Key Informant Survey” of Production, Value, Losses and ... - DfID

Create successful ePaper yourself
Turn your PDF publications into a flip-book with our unique Google optimized e-Paper software.
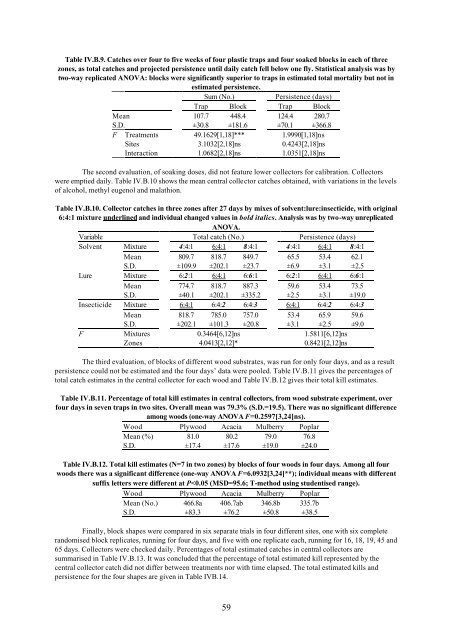
Table IV.B.9. Catches over four to five weeks <strong>of</strong> four plastic traps <strong>and</strong> four soaked blocks in each <strong>of</strong> three<br />
zones, as total catches <strong>and</strong> projected persistence until daily catch fell below one fly. Statistical analysis was by<br />
two-way replicated ANOVA: blocks were significantly superior to traps in estimated total mortality but not in<br />
estimated persistence.<br />
Sum (No.) Persistence (days)<br />
Trap Block Trap Block<br />
Mean 107.7 448.4 124.4 280.7<br />
S.D. ±30.8 ±181.6 ±70.1 ±366.8<br />
F Treatments 49.1629[1,18]*** 1.9990[1,18]ns<br />
Sites 3.1032[2,18]ns 0.4243[2,18]ns<br />
Interaction 1.0682[2,18]ns 1.0351[2,18]ns<br />
The second evaluation, <strong>of</strong> soaking doses, did not feature lower collectors for calibration. Collectors<br />
were emptied daily. Table IV.B.10 shows the mean central collector catches obtained, with variations in the levels<br />
<strong>of</strong> alcohol, methyl eugenol <strong>and</strong> malathion.<br />
Table IV.B.10. Collector catches in three zones after 27 days by mixes <strong>of</strong> solvent:lure:insecticide, with original<br />
6:4:1 mixture underlined <strong>and</strong> individual changed values in bold italics. Analysis was by two-way unreplicated<br />
ANOVA.<br />
Variable Total catch (No.) Persistence (days)<br />
Solvent Mixture 4:4:1 6:4:1 8:4:1 4:4:1 6:4:1 8:4:1<br />
Mean 809.7 818.7 849.7 65.5 53.4 62.1<br />
S.D. ±109.9 ±202.1 ±23.7 ±6.9 ±3.1 ±2.5<br />
Lure Mixture 6:2:1 6:4:1 6:6:1 6:2:1 6:4:1 6:6:1<br />
Mean 774.7 818.7 887.3 59.6 53.4 73.5<br />
S.D. ±40.1 ±202.1 ±335.2 ±2.5 ±3.1 ±19.0<br />
Insecticide Mixture 6:4:1 6:4:2 6:4:3 6:4:1 6:4:2 6:4:3<br />
Mean 818.7 785.0 757.0 53.4 65.9 59.6<br />
S.D. ±202.1 ±101.3 ±20.8 ±3.1 ±2.5 ±9.0<br />
F<br />
Mixtures 0.3464[6,12]ns 1.5811[6,12]ns<br />
Zones 4.0413[2,12]* 0.8421[2,12]ns<br />
The third evaluation, <strong>of</strong> blocks <strong>of</strong> different wood substrates, was run for only four days, <strong>and</strong> as a result<br />
persistence could not be estimated <strong>and</strong> the four days’ data were pooled. Table IV.B.11 gives the percentages <strong>of</strong><br />
total catch estimates in the central collector for each wood <strong>and</strong> Table IV.B.12 gives their total kill estimates.<br />
Table IV.B.11. Percentage <strong>of</strong> total kill estimates in central collectors, from wood substrate experiment, over<br />
four days in seven traps in two sites. Overall mean was 79.3% (S.D.=19.5). There was no significant difference<br />
among woods (one-way ANOVA F=0.2597[3,24]ns).<br />
Wood Plywood Acacia Mulberry Poplar<br />
Mean (%) 81.0 80.2 79.0 76.8<br />
S.D. ±17.4 ±17.6 ±19.0 ±24.0<br />
Table IV.B.12. Total kill estimates (N=7 in two zones) by blocks <strong>of</strong> four woods in four days. Among all four<br />
woods there was a significant difference (one-way ANOVA F=6.0932[3,24]**); individual means with different<br />
suffix letters were different at P