“Key Informant Survey” of Production, Value, Losses and ... - DfID
“Key Informant Survey” of Production, Value, Losses and ... - DfID
“Key Informant Survey” of Production, Value, Losses and ... - DfID

Create successful ePaper yourself
Turn your PDF publications into a flip-book with our unique Google optimized e-Paper software.
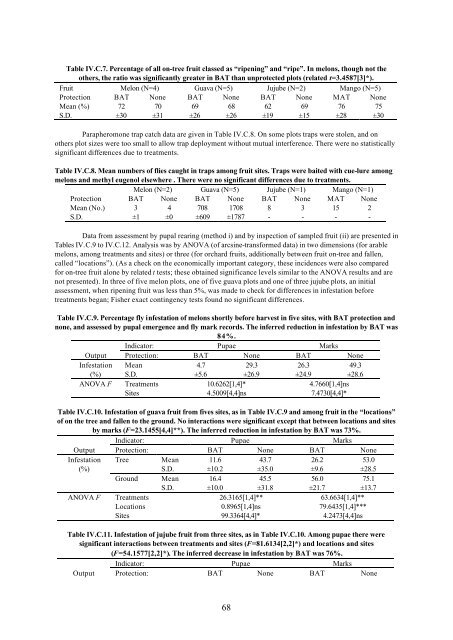
Table IV.C.7. Percentage <strong>of</strong> all on-tree fruit classed as “ripening” <strong>and</strong> “ripe”. In melons, though not the<br />
others, the ratio was significantly greater in BAT than unprotected plots (related t=3.4587[3]*).<br />
Fruit Melon (N=4) Guava (N=5) Jujube (N=2) Mango (N=5)<br />
Protection BAT None BAT None BAT None MAT None<br />
Mean (%) 72 70 69 68 62 69 76 75<br />
S.D. ±30 ±31 ±26 ±26 ±19 ±15 ±28 ±30<br />
Parapheromone trap catch data are given in Table IV.C.8. On some plots traps were stolen, <strong>and</strong> on<br />
others plot sizes were too small to allow trap deployment without mutual interference. There were no statistically<br />
significant differences due to treatments.<br />
Table IV.C.8. Mean numbers <strong>of</strong> flies caught in traps among fruit sites. Traps were baited with cue-lure among<br />
melons <strong>and</strong> methyl eugenol elsewhere . There were no significant differences due to treatments.<br />
Melon (N=2) Guava (N=5) Jujube (N=1) Mango (N=1)<br />
Protection BAT None BAT None BAT None MAT None<br />
Mean (No.) 3 4 708 1708 8 3 15 2<br />
S.D. ±1 ±0 ±609 ±1787 - - - -<br />
Data from assessment by pupal rearing (method i) <strong>and</strong> by inspection <strong>of</strong> sampled fruit (ii) are presented in<br />
Tables IV.C.9 to IV.C.12. Analysis was by ANOVA (<strong>of</strong> arcsine-transformed data) in two dimensions (for arable<br />
melons, among treatments <strong>and</strong> sites) or three (for orchard fruits, additionally between fruit on-tree <strong>and</strong> fallen,<br />
called “locations”). (As a check on the economically important category, these incidences were also compared<br />
for on-tree fruit alone by related t tests; these obtained significance levels similar to the ANOVA results <strong>and</strong> are<br />
not presented). In three <strong>of</strong> five melon plots, one <strong>of</strong> five guava plots <strong>and</strong> one <strong>of</strong> three jujube plots, an initial<br />
assessment, when ripening fruit was less than 5%, was made to check for differences in infestation before<br />
treatments began; Fisher exact contingency tests found no significant differences.<br />
Table IV.C.9. Percentage fly infestation <strong>of</strong> melons shortly before harvest in five sites, with BAT protection <strong>and</strong><br />
none, <strong>and</strong> assessed by pupal emergence <strong>and</strong> fly mark records. The inferred reduction in infestation by BAT was<br />
84%.<br />
Indicator: Pupae Marks<br />
Output Protection: BAT None BAT None<br />
Infestation Mean 4.7 29.3 26.3 49.3<br />
(%) S.D. ±5.6 ±26.9 ±24.9 ±28.6<br />
ANOVA F Treatments 10.6262[1,4]* 4.7660[1,4]ns<br />
Sites 4.5009[4,4]ns 7.4730[4,4]*<br />
Table IV.C.10. Infestation <strong>of</strong> guava fruit from fives sites, as in Table IV.C.9 <strong>and</strong> among fruit in the “locations”<br />
<strong>of</strong> on the tree <strong>and</strong> fallen to the ground. No interactions were significant except that between locations <strong>and</strong> sites<br />
by marks (F=23.1455[4,4]**). The inferred reduction in infestation by BAT was 73%.<br />
Indicator: Pupae Marks<br />
Output Protection: BAT None BAT None<br />
Infestation Tree Mean 11.6 43.7 26.2 53.0<br />
(%)<br />
S.D. ±10.2 ±35.0 ±9.6 ±28.5<br />
Ground Mean 16.4 45.5 56.0 75.1<br />
S.D. ±10.0 ±31.8 ±21.7 ±13.7<br />
ANOVA F Treatments 26.3165[1,4]** 63.6634[1,4]**<br />
Locations 0.8965[1,4]ns 79.6435[1,4]***<br />
Sites 99.3364[4,4]* 4.2473[4,4]ns<br />
Table IV.C.11. Infestation <strong>of</strong> jujube fruit from three sites, as in Table IV.C.10. Among pupae there were<br />
significant interactions between treatments <strong>and</strong> sites (F=81.6134[2,2]*) <strong>and</strong> locations <strong>and</strong> sites<br />
(F=54.1577[2,2]*). The inferred decrease in infestation by BAT was 76%.<br />
Indicator: Pupae Marks<br />
Output Protection: BAT None BAT None<br />
68