- Page 1 and 2:
Dear Colleague, Integrated Manageme
- Page 3 and 4:
each zone will be divided by the to
- Page 5 and 6:
Sheet 2. Production and fruit fly l
- Page 7 and 8:
Product: Muskmelon Himalayan Highla
- Page 9 and 10:
Product: Snake Gourd Himalayan High
- Page 11 and 12:
Integrated Management of Fruit Flie
- Page 13 and 14:
Palanpur Pumpkin 2 Anand Bitter Gou
- Page 15 and 16:
Integrated Management of Fruit Flie
- Page 17 and 18:
Navsari Thiruvananthapuram
- Page 19 and 20:
The power of parapheromones. This I
- Page 21 and 22:
Cluster “Western” “Southern
- Page 23 and 24:
Indian fruit fly control and the So
- Page 25 and 26:
INTEGRATED MANAGEMENT OF FRUIT FLIE
- Page 27 and 28:
They used to be nearer Ahmedabad, a
- Page 29 and 30:
FRUIT FLY CONTROL: SPRAYS (i) Spray
- Page 31 and 32:
fruit borer, little leaf (a mycopla
- Page 33 and 34:
ores the vine from tender portion,
- Page 35 and 36:
(DDVP). He is applying both ME and
- Page 37 and 38:
CROPS He said that he is growing bi
- Page 39 and 40:
that spraying insecticides is only
- Page 41 and 42:
vegetables not by having greater wa
- Page 43 and 44:
advantage of bitter gourd? He start
- Page 45 and 46:
isk of complete failure of crop. Am
- Page 47 and 48:
FF MANAGEMENT He said that he using
- Page 49 and 50:
eady-to-harvest fruits. Farmers los
- Page 51 and 52:
Gandevi. #G008 DATE: 03/01/04 TEAM:
- Page 53 and 54:
#R004 DATE:08/03 TEAM: JT/CVV. He i
- Page 55 and 56:
he has found this as very reasonabl
- Page 57 and 58:
improving the fertility condition o
- Page 59 and 60:
50 cents, banana intercropped in co
- Page 61 and 62:
with grass. When the field is left
- Page 63 and 64:
sells his own produce. CROPS He gro
- Page 65 and 66:
it. When JS mimes a jumping FF magg
- Page 67 and 68:
other pests). RICE AND ITS PESTS In
- Page 69 and 70:
(mother) feed voraciously on leaf l
- Page 71 and 72:
yellow and drop. On opening of the
- Page 73 and 74:
including semilooper because fruit
- Page 75 and 76:
off prematurely from plants. Thus p
- Page 77 and 78:
PEST: FRUIT FLIES Losses: Bitter go
- Page 79 and 80:
PEST: SEMILOOPER Creates problems i
- Page 81 and 82:
semi looper pest bitter gourd at an
- Page 83 and 84:
FRUIT FLIES July sown crop suffers
- Page 85 and 86:
LEAF CURL He said that this serious
- Page 87 and 88:
only own farm total area five ha. N
- Page 89 and 90:
PEST 1 - MANGO HOPPER is number one
- Page 91 and 92:
PROJECT MEMORANDUM on behalf of the
- Page 93 and 94:
4. Starting and finishing dates 1 J
- Page 95 and 96:
Fruit flies, although a serious pes
- Page 97 and 98:
Department of Agricultural Extensio
- Page 99 and 100:
SECTION C: SCIENTIFIC BACKGROUND 17
- Page 101 and 102:
Pakistan-UK Fruit Fly Project 1998-
- Page 103 and 104:
This will connect the field researc
- Page 105 and 106:
Narrative Summary Goal Objectively
- Page 107 and 108:
YEAR 2 2002-2003 MONTH Activity A M
- Page 109 and 110:
Table I.2. Subjectively-derived syn
- Page 111 and 112:
Jujube 3 - S Bawal Dashad et al. (1
- Page 113 and 114:
Appendix II. Scientific Research on
- Page 115 and 116:
Museum has B. dorsalis specimens re
- Page 117 and 118:
and if neem can be used in attracta
- Page 119 and 120:
coast. In the Faisalabad area attac
- Page 121 and 122: elative, and offer little real comm
- Page 123 and 124: Appendix III. Work Plan ACTIVITIES
- Page 125 and 126: 1.1.4: Tabulation of Controls Findi
- Page 127 and 128: other methods. In fields where loss
- Page 129 and 130: In addition to the Key Informant Su
- Page 131 and 132: killing points”, and these techni
- Page 133 and 134: tiers. It is proposed to replace th
- Page 135 and 136: general benefit. Socially-cooperati
- Page 137 and 138: greater than the sum of their parts
- Page 139 and 140: Appendix IV. Prior Scientific Paper
- Page 141 and 142: vi - Value of cucurbit extract comp
- Page 143 and 144: Methods The assessment of BAT and M
- Page 145 and 146: surfaces - cotton cloth, plastic sh
- Page 147 and 148: Table IV.B.4. Mean total catches (N
- Page 149 and 150: Table IV.B.9. Catches over four to
- Page 151 and 152: Many improvements may be made to th
- Page 153 and 154: economic damage per fly will be gre
- Page 155 and 156: Table IV.C.1. Fruit infestation ass
- Page 157 and 158: factors (ecoregion, year, season, w
- Page 159 and 160: Infestation (%) ANOVA F Tree Mean 3
- Page 161 and 162: Appendix V. References Afzal, M, Ma
- Page 163 and 164: Jalaluddin, SM, Natarajan, K, Sadak
- Page 165 and 166: cucurbitae Coquillett) in cucumber.
- Page 167 and 168: Sharma, VP, Lal, OP, Rohidas, SB, P
- Page 169 and 170: Project Integrated Management of Fr
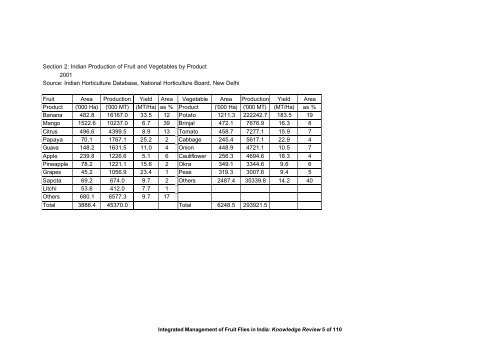
- Page 171: Section 1: Indian Fruit and Vegetab
- Page 175 and 176: Section 4: Fruit Fly Species Report
- Page 177 and 178: 56 Gastrozona balioptera 57 G. fasc
- Page 179 and 180: 114 P. tetrica 115 Indacilira basiv
- Page 181 and 182: Section 5: Hosts of Tephritid Fruit
- Page 183 and 184: 56 Cucumis melo var. utilissimus Cu
- Page 185 and 186: 118 Physalis peruviana Solanaceae C
- Page 187 and 188: Bactrocera sp. T. dioica Mondouri,
- Page 189 and 190: B. cucurbitae Mogekai Karnataka Kum
- Page 191 and 192: B. carambolae Andaman Islands Ranga
- Page 193 and 194: Jujube 20 20 60 40 N Gujarat xi,xii
- Page 195 and 196: Mango 9.8 9.8 10 10 10 N Kanpur vi
- Page 197 and 198: Cucumber 6.2 6.2 6 6 6 S South Anda
- Page 199 and 200: Section 8: Population Dynamics and
- Page 201 and 202: B. dorsalis Mango Kanpur, Uttar Pra
- Page 203 and 204: C. vesuviana Jujube Haryana Lakra a
- Page 205 and 206: Meridarchis scyrodes, Carpomyia ves
- Page 207 and 208: B. cucurbitae Bitter gourd Thakur e
- Page 209 and 210: B. cucurbitae C melo, C callosus B.
- Page 211 and 212: B. correcta Guava Jalaluddin and 19
- Page 213 and 214: B. cucurbitae 82 cucurbits Nath et
- Page 215 and 216: B. cucurbitae Singh et al. 2000 The
- Page 217 and 218: B. cucurbitae Gowda et al. 1979 An
- Page 219 and 220: B. cucurbitae Kaur and Srivastava B
- Page 221 and 222: B. dorsalis Srivastava et al. 1989
- Page 223 and 224:
B. dorsalis Prasad and Sethi 1981 T
- Page 225 and 226:
Section 12: Natural Enemies Host En
- Page 227 and 228:
Section 13: Cultural Controls Fly H
- Page 229 and 230:
B. cucurbitae Bhagat and Koul B. cu
- Page 231 and 232:
B. cucurbitae Bitter gourd Gupta an
- Page 233 and 234:
B. zonata Peach Himachal Pradesh B.
- Page 235 and 236:
B. cucurbitae Bitter gourd Mote 197
- Page 237 and 238:
B. cucurbitae Ccumber, ridge gourd
- Page 239 and 240:
Zaprionus paravittiger [Z. indianus
- Page 241 and 242:
B. zonata Apple, peach Solan, Himac
- Page 243 and 244:
B. cucurbitae B. cucurbitae B. cucu
- Page 245 and 246:
Section 16: Pheromone and Colour Lu
- Page 247 and 248:
B. dorsalis Mango Pantnagar Uttar P
- Page 249 and 250:
B. cucurbitae Snake gourd Banglades
- Page 251 and 252:
Bagle, B.G. Prasad, V.G. 1983 Effec
- Page 253 and 254:
Borah, S.R. Dutta, S.K. 1997 Infest
- Page 255 and 256:
Drew, R.A.I. Raghu, S. 2002 The fru
- Page 257 and 258:
Gupta, K. Anand, M. 2002 Effect of
- Page 259 and 260:
Kapoor, V.C. Grewal, J.S. Agarwal,
- Page 261 and 262:
KrishnaMoorthy, P.N. Srinivasan, K.
- Page 263 and 264:
Nair, S. Thomas, J. 2001 Ovipositio
- Page 265 and 266:
Patel, R.K. Patel, C.B. 1998 Biolog
- Page 267 and 268:
Rahman, S Singh, S.P.N. Agarwal, M.
- Page 269 and 270:
Shivarkar, D.T. Dumbre, R.B. 1985 B
- Page 271 and 272:
Srivastava, B.G. Pant, N.C. Chaudhr
- Page 273 and 274:
Wadhwani, K. Khan, N.H. 1983 Effect
- Page 275 and 276:
Anon. 1994 Distribution Maps of Pes
- Page 277 and 278:
Anon. 1998 Population dynamics of B