Filing at a Glance General Information - Delaware Insurance ...
Filing at a Glance General Information - Delaware Insurance ...
Filing at a Glance General Information - Delaware Insurance ...

Create successful ePaper yourself
Turn your PDF publications into a flip-book with our unique Google optimized e-Paper software.
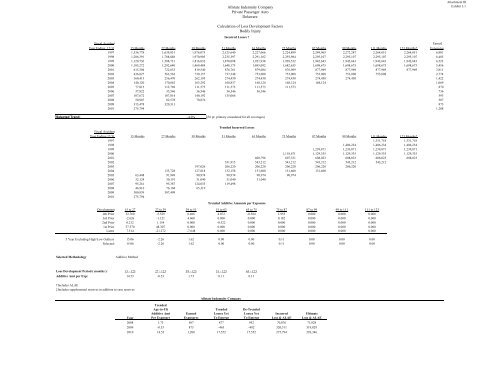
Fiscal Accident Earned<br />
Year Ending 12/31 15 Months 27 Months 39 Months 51 Months 63 Months 75 Months 87 Months 99 Months 111 Months 123 Months‡ Exposures<br />
1997 1,336,778 1,639,831 1,976,075 2,125,640 2,227,066 2,224,899 2,249,965 2,272,287 2,264,051 2,264,051 6,801<br />
1998 1,286,391 1,788,848 1,970,905 2,235,397 2,291,102 2,293,984 2,295,107 2,295,107 2,295,107 2,295,107 6,485<br />
1999 1,120,736 1,508,731 1,816,832 1,878,098 1,921,938 1,928,532 1,942,643 1,942,643 1,942,643 1,942,643 6,523<br />
2000 1,185,272 1,292,640 1,469,484 1,648,173 1,695,092 1,682,635 1,698,675 1,698,675 1,698,675 1,698,675 5,456<br />
2001 615,304 722,633 819,540 876,761 879,084 876,969 877,969 877,969 877,969 877,969 3,811<br />
2002 436,827 563,562 730,157 737,348 753,008 753,008 753,008 753,008 753,008 2,774<br />
2003 160,413 256,470 262,195 274,430 274,430 274,430 274,430 274,430 1,422<br />
2004 140,120 170,842 163,292 168,837 168,124 168,124 168,124 1,069<br />
2005 77,815 112,769 111,573 111,573 111,573 111,573 870<br />
2006 37,822 35,546 36,546 36,546 36,546 736<br />
2007 107,672 107,814 140,192 135,066 593<br />
2008 50,907 82,578 70,876 507<br />
2009 313,478 320,311 873<br />
2010 275,794 1,208<br />
Selected Trend: -4.0%<br />
Trended Incurred Losses<br />
Fiscal Accident<br />
Year Ending 12/31 15 Months 27 Months 39 Months 51 Months 63 Months 75 Months 87 Months 99 Months 111 Months 123 Months‡<br />
1997 1,331,718 1,331,718<br />
1998 1,406,234 1,406,234 1,406,234<br />
1999 1,239,871 1,239,871 1,239,871 1,239,871<br />
2000 1,118,671 1,129,335 1,129,335 1,129,335 1,129,335<br />
2001 608,796 607,331 608,023 608,023 608,023 608,023<br />
2002 531,915 543,212 543,212 543,212 543,212 543,212<br />
2003 197,026 206,220 206,220 206,220 206,220 206,220<br />
2004 133,728 127,818 132,158 131,600 131,600 131,600<br />
2005 63,448 91,949 90,974 90,974 90,974 90,974<br />
2006 32,124 30,191 31,040 31,040 31,040<br />
2007 95,261 95,387 124,033 119,498<br />
2008 46,916 76,104 65,319<br />
2009 300,939 307,499<br />
2010 275,794<br />
Development 15 to 27 27 to 39 39 to 51 51 to 63 63 to 75 75 to 87 87 to 99 99 to 111 111 to 123<br />
4th Prior 32.760 -5.529 6.466 4.072 -0.384 1.955 0.000 0.000 0.000<br />
3rd Prior -2.626 -1.121 4.060 0.000 0.000 0.182 0.000 0.000 0.000<br />
2nd Prior 0.212 1.154 0.000 -0.522 0.000 0.000 0.000 0.000 0.000<br />
1st Prior 57.570 48.307 0.000 0.000 0.000 0.000 0.000 0.000 0.000<br />
L<strong>at</strong>est 7.514 -21.272 -7.648 0.000 0.000 0.000 0.000 0.000 0.000<br />
5 Year Excluding High/Low Outliers: 15.06 -2.26 1.62 0.00 0.00 0.11 0.00 0.00 0.00<br />
Selected: 15.06 -2.26 1.62 0.00 0.00 0.11 0.00 0.00 0.00<br />
Selected Methodology<br />
Additive Method<br />
Loss Development Period ( months ): 15 - 123 27 - 123 39 - 123 51 - 123 63 - 123<br />
Additive Amt per Exp: 14.53 -0.53 1.73 0.11 0.11<br />
†Includes ALAE<br />
‡Includes supplemental reserves in addition to case reserves<br />
Year<br />
Trended<br />
Age-to-Ult<br />
Additive Amt<br />
Per Exposure<br />
Earned<br />
Exposures<br />
Allst<strong>at</strong>e Indemnity Company<br />
Trended<br />
Losses Yet<br />
To Emerge<br />
Allst<strong>at</strong>e Indemnity Company<br />
Priv<strong>at</strong>e Passenger Auto<br />
<strong>Delaware</strong><br />
Calcul<strong>at</strong>ion of Loss Development Factors<br />
Bodily Injury<br />
Incurred Losses †<br />
(36 pt. primary considered for all coverages)<br />
Trended Additive Amounts per Exposure<br />
De-Trended<br />
Losses Yet<br />
To Emerge<br />
Incurred<br />
Loss & ALAE<br />
Ultim<strong>at</strong>e<br />
Loss & ALAE<br />
2008 1.73 507 877 952 70,876 71,828<br />
2009 -0.53 873 -463 -482 320,311 319,829<br />
2010 14.53 1,208 17,552 17,552 275,794 293,346<br />
Attachment III<br />
Exhibit 3.1