Filing at a Glance General Information - Delaware Insurance ...
Filing at a Glance General Information - Delaware Insurance ...
Filing at a Glance General Information - Delaware Insurance ...

You also want an ePaper? Increase the reach of your titles
YUMPU automatically turns print PDFs into web optimized ePapers that Google loves.
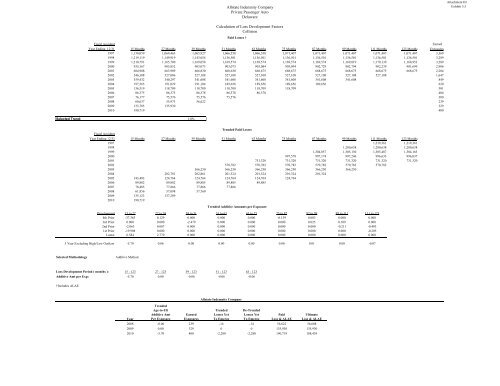
Fiscal Accident Earned<br />
Year Ending 12/31 15 Months 27 Months 39 Months 51 Months 63 Months 75 Months 87 Months 99 Months 111 Months 123 Months Exposures<br />
1997 1,130,059 1,069,463 1,065,927 1,066,558 1,066,558 1,071,407 1,071,407 1,071,407 1,071,407 1,071,407 3,369<br />
1998 1,219,119 1,149,919 1,143,054 1,136,501 1,136,501 1,136,501 1,136,501 1,136,501 1,136,501 1,136,501 3,289<br />
1999 1,210,791 1,165,700 1,169,058 1,169,574 1,169,574 1,169,574 1,169,574 1,169,819 1,170,139 1,168,952 3,289<br />
2000 935,167 905,852 903,073 903,073 903,084 903,094 902,729 902,794 902,239 901,699 2,906<br />
2001 684,988 663,909 666,830 668,630 668,675 668,675 668,675 668,675 668,675 668,675 2,204<br />
2002 546,308 527,086 527,108 527,108 527,108 527,108 527,108 527,108 527,108 1,647<br />
2003 359,432 340,297 341,608 341,608 341,608 341,608 341,608 341,608 849<br />
2004 197,565 191,029 191,104 189,656 189,656 189,656 189,656 620<br />
2005 136,519 118,709 118,709 118,709 118,709 118,709 501<br />
2006 86,375 86,375 86,378 86,378 86,378 404<br />
2007 76,177 75,576 75,576 75,576 300<br />
2008 60,637 55,973 56,622 239<br />
2009 133,785 135,930 329<br />
2010 190,719 400<br />
Selected Trend: 1.0%<br />
Trended Paid Losses<br />
Fiscal Accident<br />
Year Ending 12/31 15 Months 27 Months 39 Months 51 Months 63 Months 75 Months 87 Months 99 Months 111 Months 123 Months<br />
1997 1,219,361 1,219,361<br />
1998 1,280,638 1,280,638 1,280,638<br />
1999 1,304,857 1,305,130 1,305,487 1,304,163<br />
2000 997,578 997,174 997,246 996,633 996,037<br />
2001 731,320 731,320 731,320 731,320 731,320 731,320<br />
2002 570,782 570,782 570,782 570,782 570,782 570,782<br />
2003 366,250 366,250 366,250 366,250 366,250 366,250<br />
2004 202,781 202,861 201,324 201,324 201,324 201,324<br />
2005 143,483 124,764 124,764 124,764 124,764 124,764<br />
2006 89,882 89,882 89,885 89,885 89,885<br />
2007 78,485 77,866 77,866 77,866<br />
2008 61,856 57,098 57,760<br />
2009 135,123 137,289<br />
2010 190,719<br />
Development 15 to 27 27 to 39 39 to 51 51 to 63 63 to 75 75 to 87 87 to 99 99 to 111 111 to 123<br />
4th Prior -37.363 0.129 0.000 0.000 0.000 -0.139 0.083 0.000 0.000<br />
3rd Prior 0.000 0.000 -2.479 0.000 0.000 0.000 0.025 0.109 0.000<br />
2nd Prior -2.063 0.007 0.000 0.000 0.000 0.000 0.000 -0.211 -0.403<br />
1st Prior -19.908 0.000 0.000 0.000 0.000 0.000 0.000 0.000 -0.205<br />
L<strong>at</strong>est 6.584 2.770 0.000 0.000 0.000 0.000 0.000 0.000 0.000<br />
5 Year Excluding High/Low Outliers -5.70 0.06 0.00 0.00 0.00 0.00 0.01 0.00 -0.07<br />
Selected Methodology<br />
Loss Development Period ( months ): 15 - 123 27 - 123 39 - 123 51 - 123 63 - 123<br />
Additive Amt per Exp: -5.70 0.00 -0.06 -0.06 -0.06<br />
†Includes ALAE<br />
Additive Method<br />
Year<br />
Trended<br />
Age-to-Ult<br />
Additive Amt<br />
Per Exposure<br />
Earned<br />
Exposures<br />
Allst<strong>at</strong>e Indemnity Company<br />
Trended<br />
Losses Yet<br />
To Emerge<br />
Allst<strong>at</strong>e Indemnity Company<br />
Priv<strong>at</strong>e Passenger Auto<br />
<strong>Delaware</strong><br />
Calcul<strong>at</strong>ion of Loss Development Factors<br />
Collision<br />
Paid Losses †<br />
Trended Additive Amounts per Exposure<br />
De-Trended<br />
Losses Yet<br />
To Emerge<br />
Paid<br />
Loss & ALAE<br />
Ultim<strong>at</strong>e<br />
Loss & ALAE<br />
2008 -0.06 239 -14 -14 56,622 56,608<br />
2009 0.00 329 0 0 135,930 135,930<br />
2010 -5.70 400 -2,280 -2,280 190,719 188,439<br />
Attachment III<br />
Exhibit 3.5