Filing at a Glance General Information - Delaware Insurance ...
Filing at a Glance General Information - Delaware Insurance ...
Filing at a Glance General Information - Delaware Insurance ...

You also want an ePaper? Increase the reach of your titles
YUMPU automatically turns print PDFs into web optimized ePapers that Google loves.
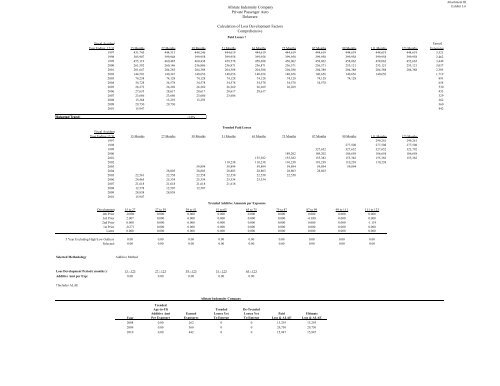
Fiscal Accident Earned<br />
Year Ending 12/31 15 Months 27 Months 39 Months 51 Months 63 Months 75 Months 87 Months 99 Months 111 Months 123 Months Exposures<br />
1997 431,745 444,313 444,246 444,619 444,619 444,619 444,619 444,619 444,619 444,619 3,521<br />
1998 385,907 399,948 399,958 399,958 399,958 399,958 399,958 399,958 399,958 399,958 3,462<br />
1999 455,119 460,485 460,438 459,578 458,698 458,062 458,062 458,062 458,062 452,665 3,449<br />
2000 261,592 260,146 256,886 256,871 256,871 256,571 256,571 253,121 253,121 253,121 3,037<br />
2001 201,647 204,283 204,388 204,388 204,388 204,388 204,388 204,388 204,388 204,388 2,305<br />
2002 144,501 140,347 140,656 140,656 140,656 140,656 140,656 140,656 140,656 1,719<br />
2003 74,238 74,128 74,128 74,128 74,128 74,128 74,128 74,128 891<br />
2004 34,728 34,578 34,578 34,578 34,578 34,578 34,578 654<br />
2005 26,272 26,269 26,269 26,269 26,269 26,269 530<br />
2006 27,635 28,617 28,617 28,617 28,617 433<br />
2007 23,686 23,686 23,686 23,686 329<br />
2008 13,368 13,293 13,293 262<br />
2009 29,730 29,730 360<br />
2010 15,947 442<br />
Selected Trend: -3.0%<br />
Trended Paid Losses<br />
Fiscal Accident<br />
Year Ending 12/31 15 Months 27 Months 39 Months 51 Months 63 Months 75 Months 87 Months 99 Months 111 Months 123 Months<br />
1997 299,241 299,241<br />
1998 277,508 277,508 277,508<br />
1999 327,652 327,652 327,652 323,792<br />
2000 189,202 189,202 186,658 186,658 186,658<br />
2001 155,382 155,382 155,382 155,382 155,382 155,382<br />
2002 110,238 110,238 110,238 110,238 110,238 110,238<br />
2003 59,894 59,894 59,894 59,894 59,894 59,894<br />
2004 28,803 28,803 28,803 28,803 28,803 28,803<br />
2005 22,561 22,558 22,558 22,558 22,558 22,558<br />
2006 24,465 25,334 25,334 25,334 25,334<br />
2007 21,618 21,618 21,618 21,618<br />
2008 12,578 12,507 12,507<br />
2009 28,838 28,838<br />
2010 15,947<br />
Development 15 to 27 27 to 39 39 to 51 51 to 63 63 to 75 75 to 87 87 to 99 99 to 111 111 to 123<br />
4th Prior -0.006 0.000 0.000 0.000 0.000 0.000 0.000 0.000 0.000<br />
3rd Prior 2.007 0.000 0.000 0.000 0.000 0.000 -0.838 0.000 0.000<br />
2nd Prior 0.000 0.000 0.000 0.000 0.000 0.000 0.000 0.000 -1.119<br />
1st Prior -0.271 0.000 0.000 0.000 0.000 0.000 0.000 0.000 0.000<br />
L<strong>at</strong>est 0.000 0.000 0.000 0.000 0.000 0.000 0.000 0.000 0.000<br />
5 Year Excluding High/Low Outliers: 0.00 0.00 0.00 0.00 0.00 0.00 0.00 0.00 0.00<br />
Selected: 0.00 0.00 0.00 0.00 0.00 0.00 0.00 0.00 0.00<br />
Selected Methodology<br />
Loss Development Period ( months ): 15 - 123 27 - 123 39 - 123 51 - 123 63 - 123<br />
Additive Amt per Exp: 0.00 0.00 0.00 0.00 0.00<br />
†Includes ALAE<br />
Additive Method<br />
Year<br />
Trended<br />
Age-to-Ult<br />
Additive Amt<br />
Per Exposure<br />
Earned<br />
Exposures<br />
Allst<strong>at</strong>e Indemnity Company<br />
Trended<br />
Losses Yet<br />
To Emerge<br />
Allst<strong>at</strong>e Indemnity Company<br />
Priv<strong>at</strong>e Passenger Auto<br />
<strong>Delaware</strong><br />
Calcul<strong>at</strong>ion of Loss Development Factors<br />
Comprehensive<br />
Paid Losses †<br />
Trended Additive Amounts per Exposure<br />
De-Trended<br />
Losses Yet<br />
To Emerge<br />
Paid<br />
Loss & ALAE<br />
Ultim<strong>at</strong>e<br />
Loss & ALAE<br />
2008 0.00 262 0 0 13,293 13,293<br />
2009 0.00 360 0 0 29,730 29,730<br />
2010 0.00 442 0 0 15,947 15,947<br />
Attachment III<br />
Exhibit 3.6