Filing at a Glance General Information - Delaware Insurance ...
Filing at a Glance General Information - Delaware Insurance ...
Filing at a Glance General Information - Delaware Insurance ...

Create successful ePaper yourself
Turn your PDF publications into a flip-book with our unique Google optimized e-Paper software.
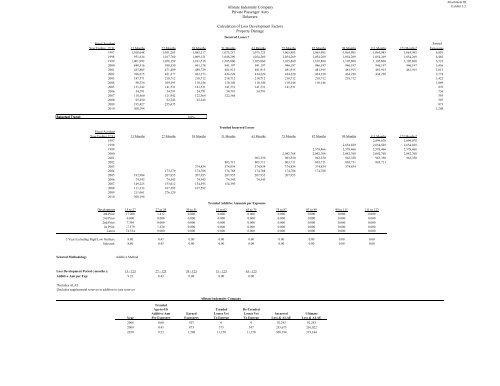
Fiscal Accident Earned<br />
Year Ending 12/31 15 Months 27 Months 39 Months 51 Months 63 Months 75 Months 87 Months 99 Months 111 Months 123 Months‡ Exposures<br />
1997 1,018,648 1,051,203 1,085,217 1,075,217 1,075,723 1,065,985 1,065,985 1,065,985 1,065,985 1,065,985 6,801<br />
1998 931,634 1,017,760 1,069,121 1,046,290 1,054,269 1,054,269 1,054,269 1,054,269 1,054,269 1,054,269 6,485<br />
1999 1,001,992 1,058,159 1,101,518 1,105,860 1,105,860 1,105,860 1,105,860 1,105,860 1,105,860 1,105,860 6,523<br />
2000 848,516 930,350 961,178 941,197 941,197 946,197 946,197 946,197 946,197 946,197 5,456<br />
2001 435,805 471,489 488,739 481,915 481,915 481,915 481,915 481,915 481,915 481,915 3,811<br />
2002 398,675 421,277 432,273 434,220 434,220 434,220 434,220 434,220 434,220 2,774<br />
2003 187,571 218,712 218,712 218,712 218,712 218,712 218,712 218,712 1,422<br />
2004 98,334 109,195 110,146 110,146 110,146 110,146 110,146 1,069<br />
2005 131,342 141,531 141,531 141,531 141,531 141,531 870<br />
2006 54,791 54,791 54,791 54,791 54,791 736<br />
2007 118,460 121,942 122,564 122,564 593<br />
2008 95,450 92,243 92,243 507<br />
2009 195,427 255,675 873<br />
2010 308,194 1,208<br />
Selected Trend: 8.0%<br />
Trended Incurred Losses<br />
Fiscal Accident<br />
Year Ending 12/31 15 Months 27 Months 39 Months 51 Months 63 Months 75 Months 87 Months 99 Months 111 Months 123 Months‡<br />
1997 2,899,078 2,899,078<br />
1998 2,654,829 2,654,829 2,654,829<br />
1999 2,578,466 2,578,466 2,578,466 2,578,466<br />
2000 2,042,768 2,042,768 2,042,768 2,042,768 2,042,768<br />
2001 963,350 963,350 963,350 963,350 963,350 963,350<br />
2002 803,711 803,711 803,711 803,711 803,711 803,711<br />
2003 374,834 374,834 374,834 374,834 374,834 374,834<br />
2004 173,279 174,788 174,788 174,788 174,788 174,788<br />
2005 192,984 207,955 207,955 207,955 207,955 207,955<br />
2006 74,543 74,543 74,543 74,543 74,543<br />
2007 149,225 153,612 154,395 154,395<br />
2008 111,333 107,592 107,592<br />
2009 211,061 276,129<br />
2010 308,194<br />
Development 15 to 27 27 to 39 39 to 51 51 to 63 63 to 75 75 to 87 87 to 99 99 to 111 111 to 123<br />
4th Prior 17.208 1.412 0.000 0.000 0.000 0.000 0.000 0.000 0.000<br />
3rd Prior 0.000 0.000 0.000 0.000 0.000 0.000 0.000 0.000 0.000<br />
2nd Prior 7.398 0.000 0.000 0.000 0.000 0.000 0.000 0.000 0.000<br />
1st Prior -7.379 1.320 0.000 0.000 0.000 0.000 0.000 0.000 0.000<br />
L<strong>at</strong>est 74.534 0.000 0.000 0.000 0.000 0.000 0.000 0.000 0.000<br />
5 Year Excluding High/Low Outliers: 8.80 0.43 0.00 0.00 0.00 0.00 0.00 0.00 0.00<br />
Selected: 8.80 0.43 0.00 0.00 0.00 0.00 0.00 0.00 0.00<br />
Selected Methodology<br />
Additive Method<br />
Loss Development Period ( months ): 15 - 123 27 - 123 39 - 123 51 - 123 63 - 123<br />
Additive Amt per Exp: 9.23 0.43 0.00 0.00 0.00<br />
†Includes ALAE<br />
‡Includes supplemental reserves in addition to case reserves<br />
Year<br />
Trended<br />
Age-to-Ult<br />
Additive Amt<br />
Per Exposure<br />
Earned<br />
Exposures<br />
Allst<strong>at</strong>e Indemnity Company<br />
Trended<br />
Losses Yet<br />
To Emerge<br />
Allst<strong>at</strong>e Indemnity Company<br />
Priv<strong>at</strong>e Passenger Auto<br />
<strong>Delaware</strong><br />
Calcul<strong>at</strong>ion of Loss Development Factors<br />
Property Damage<br />
Incurred Losses †<br />
Trended Additive Amounts per Exposure<br />
De-Trended<br />
Losses Yet<br />
To Emerge<br />
Incurred<br />
Loss & ALAE<br />
Ultim<strong>at</strong>e<br />
Loss & ALAE<br />
2008 0.00 507 0 0 92,243 92,243<br />
2009 0.43 873 375 347 255,675 256,022<br />
2010 9.23 1,208 11,150 11,150 308,194 319,344<br />
Attachment III<br />
Exhibit 3.2