Filing at a Glance General Information - Delaware Insurance ...
Filing at a Glance General Information - Delaware Insurance ...
Filing at a Glance General Information - Delaware Insurance ...

You also want an ePaper? Increase the reach of your titles
YUMPU automatically turns print PDFs into web optimized ePapers that Google loves.
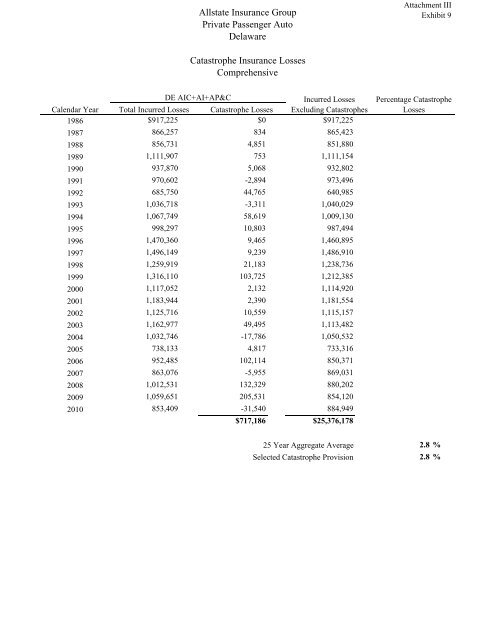
Allst<strong>at</strong>e <strong>Insurance</strong> Group<br />
Priv<strong>at</strong>e Passenger Auto<br />
<strong>Delaware</strong><br />
C<strong>at</strong>astrophe <strong>Insurance</strong> Losses<br />
Comprehensive<br />
DE AIC+AI+AP&C<br />
Incurred Losses<br />
Calendar Year Total Incurred Losses C<strong>at</strong>astrophe Losses Excluding C<strong>at</strong>astrophes<br />
1986 $917,225 $0 $917,225<br />
1987 866,257 834 865,423<br />
1988 856,731 4,851 851,880<br />
1989 1,111,907 753 1,111,154<br />
1990 937,870 5,068 932,802<br />
1991 970,602 -2,894 973,496<br />
1992 685,750 44,765 640,985<br />
1993 1,036,718 -3,311 1,040,029<br />
1994 1,067,749 58,619 1,009,130<br />
1995 998,297 10,803 987,494<br />
1996 1,470,360 9,465 1,460,895<br />
1997 1,496,149 9,239 1,486,910<br />
1998 1,259,919 21,183 1,238,736<br />
1999 1,316,110 103,725 1,212,385<br />
2000 1,117,052 2,132 1,114,920<br />
2001 1,183,944 2,390 1,181,554<br />
2002 1,125,716 10,559 1,115,157<br />
2003 1,162,977 49,495 1,113,482<br />
2004 1,032,746 -17,786 1,050,532<br />
2005 738,133 4,817 733,316<br />
2006 952,485 102,114 850,371<br />
2007 863,076 -5,955 869,031<br />
2008 1,012,531 132,329 880,202<br />
2009 1,059,651 205,531 854,120<br />
2010 853,409 -31,540 884,949<br />
$717,186 $25,376,178<br />
25 Year Aggreg<strong>at</strong>e Average<br />
Selected C<strong>at</strong>astrophe Provision<br />
Attachment III<br />
Exhibit 9<br />
Percentage C<strong>at</strong>astrophe<br />
Losses<br />
2.8 %<br />
2.8 %