Filing at a Glance General Information - Delaware Insurance ...
Filing at a Glance General Information - Delaware Insurance ...
Filing at a Glance General Information - Delaware Insurance ...

You also want an ePaper? Increase the reach of your titles
YUMPU automatically turns print PDFs into web optimized ePapers that Google loves.
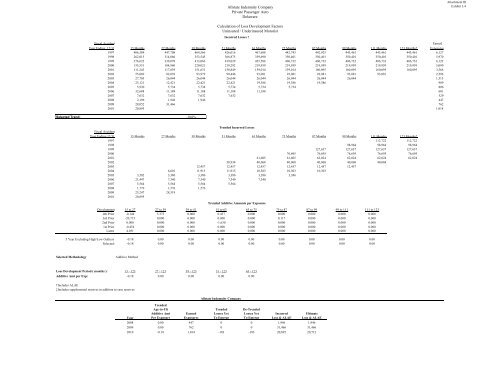
Fiscal Accident Earned<br />
Year Ending 12/31 15 Months 27 Months 39 Months 51 Months 63 Months 75 Months 87 Months 99 Months 111 Months 123 Months‡ Exposures<br />
1997 406,384 447,708 464,566 426,016 467,688 442,743 442,925 443,461 443,461 443,461 6,127<br />
1998 262,015 314,066 353,545 366,875 359,690 350,401 350,401 350,401 350,401 350,401 5,970<br />
1999 276,622 339,078 413,066 419,029 425,586 406,732 406,732 406,732 406,732 406,732 6,122<br />
2000 135,531 184,960 220,021 219,292 219,959 219,959 219,959 219,959 219,959 219,959 5,090<br />
2001 111,243 117,039 151,631 158,849 159,014 159,014 160,095 160,095 160,095 160,095 3,566<br />
2002 55,069 82,039 93,979 90,446 93,081 93,081 93,081 93,081 93,081 2,596<br />
2003 27,703 26,044 26,044 26,044 26,044 26,044 26,044 26,044 1,315<br />
2004 23,121 12,421 22,421 22,421 19,386 19,386 19,386 989<br />
2005 5,930 5,734 5,734 5,734 5,734 5,734 806<br />
2006 32,688 11,188 11,188 11,188 11,188 681<br />
2007 7,632 7,632 7,632 7,632 529<br />
2008 2,196 1,946 1,946 447<br />
2009 28,052 31,466 762<br />
2010 20,895 1,014<br />
Selected Trend: -10.0%<br />
Trended Incurred Losses<br />
Fiscal Accident<br />
Year Ending 12/31 15 Months 27 Months 39 Months 51 Months 63 Months 75 Months 87 Months 99 Months 111 Months 123 Months‡<br />
1997 112,722 112,722<br />
1998 98,964 98,964 98,964<br />
1999 127,637 127,637 127,637 127,637<br />
2000 76,695 76,695 76,695 76,695 76,695<br />
2001 61,605 61,605 62,024 62,024 62,024 62,024<br />
2002 38,934 40,068 40,068 40,068 40,068 40,068<br />
2003 12,457 12,457 12,457 12,457 12,457 12,457<br />
2004 6,601 11,915 11,915 10,303 10,303 10,303<br />
2005 3,502 3,386 3,386 3,386 3,386 3,386<br />
2006 21,447 7,340 7,340 7,340 7,340<br />
2007 5,564 5,564 5,564 5,564<br />
2008 1,779 1,576 1,576<br />
2009 25,247 28,319<br />
2010 20,895<br />
Development 15 to 27 27 to 39 39 to 51 51 to 63 63 to 75 75 to 87 87 to 99 99 to 111 111 to 123<br />
4th Prior -0.144 5.373 0.000 0.437 0.000 0.000 0.000 0.000 0.000<br />
3rd Prior -20.715 0.000 0.000 0.000 0.000 0.117 0.000 0.000 0.000<br />
2nd Prior 0.000 0.000 0.000 -1.630 0.000 0.000 0.000 0.000 0.000<br />
1st Prior -0.454 0.000 0.000 0.000 0.000 0.000 0.000 0.000 0.000<br />
L<strong>at</strong>est 4.031 0.000 0.000 0.000 0.000 0.000 0.000 0.000 0.000<br />
5 Year Excluding High/Low Outliers: -0.18 0.00 0.00 0.00 0.00 0.00 0.00 0.00 0.00<br />
Selected: -0.18 0.00 0.00 0.00 0.00 0.00 0.00 0.00 0.00<br />
Selected Methodology<br />
Additive Method<br />
Loss Development Period ( months ): 15 - 123 27 - 123 39 - 123 51 - 123 63 - 123<br />
Additive Amt per Exp: -0.18 0.00 0.00 0.00 0.00<br />
†Includes ALAE<br />
‡Includes supplemental reserves in addition to case reserves<br />
Year<br />
Trended<br />
Age-to-Ult<br />
Additive Amt<br />
Per Exposure<br />
Earned<br />
Exposures<br />
Allst<strong>at</strong>e Indemnity Company<br />
Trended<br />
Losses Yet<br />
To Emerge<br />
Allst<strong>at</strong>e Indemnity Company<br />
Priv<strong>at</strong>e Passenger Auto<br />
<strong>Delaware</strong><br />
Calcul<strong>at</strong>ion of Loss Development Factors<br />
Uninsured / Underinsured Motorist<br />
Incurred Losses †<br />
Trended Additive Amounts per Exposure<br />
De-Trended<br />
Losses Yet<br />
To Emerge<br />
Incurred<br />
Loss & ALAE<br />
Ultim<strong>at</strong>e<br />
Loss & ALAE<br />
2008 0.00 447 0 0 1,946 1,946<br />
2009 0.00 762 0 0 31,466 31,466<br />
2010 -0.18 1,014 -183 -183 20,895 20,712<br />
Attachment III<br />
Exhibit 3.4