

European Journal of Scientific Research - EuroJournals
European Journal of Scientific Research - EuroJournals
European Journal of Scientific Research - EuroJournals

You also want an ePaper? Increase the reach of your titles
YUMPU automatically turns print PDFs into web optimized ePapers that Google loves.
259 Olubunmi M. Adaramola and Jane I. Alamina<br />
<strong>Research</strong> Question ii<br />
Is there any difference between the pretest scores and the posttest scores <strong>of</strong> students in the control<br />
group within each school?<br />
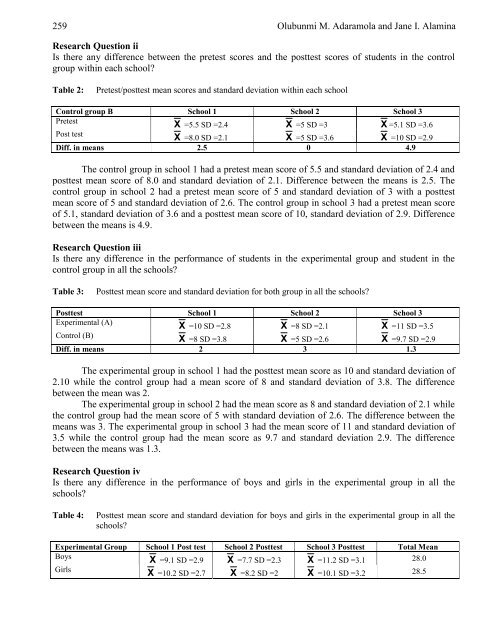
Table 2: Pretest/posttest mean scores and standard deviation within each school<br />
Control group B School 1 School 2 School 3<br />
Pretest X =5.5 SD =2.4 X =5 SD =3 X =5.1 SD =3.6<br />
Post test X =8.0 SD =2.1 X =5 SD =3.6 X =10 SD =2.9<br />
Diff. in means 2.5 0 4.9<br />
The control group in school 1 had a pretest mean score <strong>of</strong> 5.5 and standard deviation <strong>of</strong> 2.4 and<br />
posttest mean score <strong>of</strong> 8.0 and standard deviation <strong>of</strong> 2.1. Difference between the means is 2.5. The<br />
control group in school 2 had a pretest mean score <strong>of</strong> 5 and standard deviation <strong>of</strong> 3 with a posttest<br />
mean score <strong>of</strong> 5 and standard deviation <strong>of</strong> 2.6. The control group in school 3 had a pretest mean score<br />
<strong>of</strong> 5.1, standard deviation <strong>of</strong> 3.6 and a posttest mean score <strong>of</strong> 10, standard deviation <strong>of</strong> 2.9. Difference<br />
between the means is 4.9.<br />
<strong>Research</strong> Question iii<br />
Is there any difference in the performance <strong>of</strong> students in the experimental group and student in the<br />
control group in all the schools?<br />
Table 3: Posttest mean score and standard deviation for both group in all the schools?<br />
Posttest School 1 School 2 School 3<br />
Experimental (A) X =10 SD =2.8 X =8 SD =2.1 X =11 SD =3.5<br />
Control (B) X =8 SD =3.8 X =5 SD =2.6 X =9.7 SD =2.9<br />
Diff. in means 2 3 1.3<br />
The experimental group in school 1 had the posttest mean score as 10 and standard deviation <strong>of</strong><br />
2.10 while the control group had a mean score <strong>of</strong> 8 and standard deviation <strong>of</strong> 3.8. The difference<br />
between the mean was 2.<br />
The experimental group in school 2 had the mean score as 8 and standard deviation <strong>of</strong> 2.1 while<br />
the control group had the mean score <strong>of</strong> 5 with standard deviation <strong>of</strong> 2.6. The difference between the<br />
means was 3. The experimental group in school 3 had the mean score <strong>of</strong> 11 and standard deviation <strong>of</strong><br />
3.5 while the control group had the mean score as 9.7 and standard deviation 2.9. The difference<br />
between the means was 1.3.<br />
<strong>Research</strong> Question iv<br />
Is there any difference in the performance <strong>of</strong> boys and girls in the experimental group in all the<br />
schools?<br />
Table 4: Posttest mean score and standard deviation for boys and girls in the experimental group in all the<br />
schools?<br />
Experimental Group School 1 Post test School 2 Posttest School 3 Posttest Total Mean<br />
Boys X =9.1 SD =2.9 X =7.7 SD =2.3 X =11.2 SD =3.1 28.0<br />
Girls X =10.2 SD =2.7 X =8.2 SD =2 X =10.1 SD =3.2 28.5


