Annual Report 2010 in PDF - BBA Aviation
Annual Report 2010 in PDF - BBA Aviation
Annual Report 2010 in PDF - BBA Aviation

You also want an ePaper? Increase the reach of your titles
YUMPU automatically turns print PDFs into web optimized ePapers that Google loves.
Key Performance <strong>BBA</strong> <strong>Aviation</strong> uses a range of key performance <strong>in</strong>dicators (KPIs) tied to the Group’s mission statements<br />
Indicators to monitor the progress aga<strong>in</strong>st the goals which have been set to support the delivery of <strong>BBA</strong><br />
<strong>Aviation</strong>’s overall objective to grow exceptional, long-term, susta<strong>in</strong>able value for all stakeholders.<br />
18 — Directors’ <strong>Report</strong><br />
F<strong>in</strong>ancial KPIs<br />
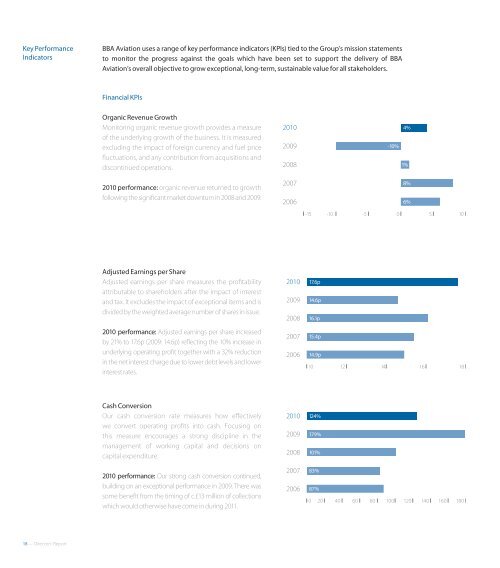
Organic Revenue Growth<br />
Monitor<strong>in</strong>g organic revenue growth provides a measure<br />
of the underly<strong>in</strong>g growth of the bus<strong>in</strong>ess. It is measured<br />
exclud<strong>in</strong>g the impact of foreign currency and fuel price<br />
fuctuations, and any contribution from acquisitions and<br />
discont<strong>in</strong>ued operations.<br />
<strong>2010</strong> performance: organic revenue returned to growth<br />
follow<strong>in</strong>g the signifcant market downturn <strong>in</strong> 2008 and 2009.<br />
Adjusted Earn<strong>in</strong>gs per Share<br />
Adjusted earn<strong>in</strong>gs per share measures the proftability<br />
attributable to shareholders after the impact of <strong>in</strong>terest<br />
and tax. It excludes the impact of exceptional items and is<br />
divided by the weighted average number of shares <strong>in</strong> issue.<br />
<strong>2010</strong> performance: Adjusted earn<strong>in</strong>gs per share <strong>in</strong>creased<br />
by 21% to 17.6p (2009: 14.6p) refect<strong>in</strong>g the 10% <strong>in</strong>crease <strong>in</strong><br />
underly<strong>in</strong>g operat<strong>in</strong>g proft together with a 32% reduction<br />
<strong>in</strong> the net <strong>in</strong>terest charge due to lower debt levels and lower<br />
<strong>in</strong>terest rates.<br />
Cash Conversion<br />
Our cash conversion rate measures how ef ectively<br />
we convert operat<strong>in</strong>g profts <strong>in</strong>to cash. Focus<strong>in</strong>g on<br />
this measure encourages a strong discipl<strong>in</strong>e <strong>in</strong> the<br />
management of work<strong>in</strong>g capital and decisions on<br />
capital expenditure.<br />
<strong>2010</strong> performance: Our strong cash conversion cont<strong>in</strong>ued,<br />
build<strong>in</strong>g on an exceptional performance <strong>in</strong> 2009. There was<br />
some beneft from the tim<strong>in</strong>g of c.£13 million of collections<br />
which would otherwise have come <strong>in</strong> dur<strong>in</strong>g 2011.<br />
<strong>2010</strong><br />
2009<br />
2008<br />
2007<br />
2006<br />
<strong>2010</strong><br />
2009<br />
2008<br />
2007<br />
2006<br />
<strong>2010</strong><br />
2009<br />
2008<br />
2007<br />
2006<br />
-10%<br />
6%<br />
-15 -10 -5 0 5 10<br />
17.6p<br />
14.6p<br />
16.1p<br />
15.4p<br />
14.9p<br />
10 12 14 16 18<br />
124%<br />
179%<br />
101%<br />
83%<br />
87%<br />
0 20 40 60 80 100 120 140 160 180<br />
4%<br />
1%<br />
8%