Annual Report 2010 in PDF - BBA Aviation
Annual Report 2010 in PDF - BBA Aviation
Annual Report 2010 in PDF - BBA Aviation

Create successful ePaper yourself
Turn your PDF publications into a flip-book with our unique Google optimized e-Paper software.
F<strong>in</strong>ancial statements Notes to the Consolidated F<strong>in</strong>ancial Statements – cont<strong>in</strong>ued<br />
85 Independent Auditor’s<br />
<strong>Report</strong> to the Members of<br />
<strong>BBA</strong> <strong>Aviation</strong> plc <strong>in</strong> Respect<br />
of the Consolidated<br />
F<strong>in</strong>ancial Statements<br />
86 Consolidated Income<br />
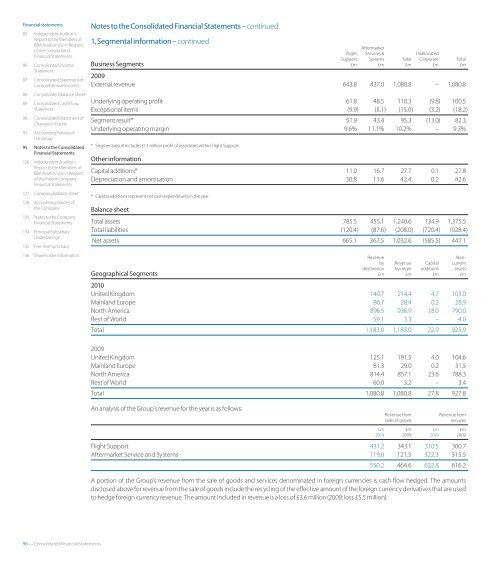
1. Segmental <strong>in</strong>formation – cont<strong>in</strong>ued<br />
Bus<strong>in</strong>ess Segments<br />
Flight<br />
Aftermarket<br />
Services &<br />
Support Systems<br />
£m £m<br />
Unallocated<br />
Total Corporate<br />
£m £m<br />
Statement<br />
87 Consolidated Statement of 2009<br />
Comprehensive Income External revenue 643.8 437.0 1,080.8 – 1,080.8<br />
88 Consolidated Balance Sheet<br />
89 Consolidated Cash Flow Underly<strong>in</strong>g operat<strong>in</strong>g profit 61.8 48.5 110.3 (9.8) 100.5<br />
Statement Exceptional items (9.9) (5.1) (15.0) (3.2) (18.2)<br />
90 Consolidated Statement of<br />
Changes <strong>in</strong> Equity<br />
91 Account<strong>in</strong>g Policies of<br />
the Group<br />
Segment result*<br />
Underly<strong>in</strong>g operat<strong>in</strong>g marg<strong>in</strong><br />
95 Notes to the Consolidated * Segment result <strong>in</strong>cludes £1.1 million proft of associates with<strong>in</strong> Flight Support.<br />
F<strong>in</strong>ancial Statements<br />
126 Independent Auditor’s<br />
<strong>Report</strong> to the Members of<br />
<strong>BBA</strong> <strong>Aviation</strong> plc <strong>in</strong> Respect<br />
of the Parent Company<br />
F<strong>in</strong>ancial Statements<br />
Other <strong>in</strong>formation<br />
51.9 43.4<br />
9.6% 11.1%<br />
95.3 (13.0)<br />
10.2% –<br />
Capital additions* 11.0 16.7 27.7 0.1 27.8<br />
Depreciation and amortisation 30.8 11.6 42.4 0.2 42.6<br />
127 Company Balance sheet<br />
* Capital additions represent net cash expenditures <strong>in</strong> the year.<br />
128 Account<strong>in</strong>g Policies of<br />
the Company Balance sheet<br />
129 Notes to the Company<br />
F<strong>in</strong>ancial Statements Total assets 785.5 455.1 1,240.6 134.9 1,375.5<br />
134 Pr<strong>in</strong>cipal Subsidiary Total liabilities (120.4) (87.6) (208.0) (720.4) (928.4)<br />
Undertak<strong>in</strong>gs<br />
Net assets 665.1 367.5 1,032.6 (585.5) 447.1<br />
135 Five Year Summary<br />
136 Shareholder Information<br />
96 — Consolidated F<strong>in</strong>ancial Statements<br />
Revenue Nonby<br />
Revenue Capital current<br />
Geographical Segments<br />
dest<strong>in</strong>ation<br />
£m<br />
by orig<strong>in</strong><br />
£m<br />
additions<br />
£m<br />
assets<br />
£m<br />
<strong>2010</strong><br />
United K<strong>in</strong>gdom 140.7 214.4 4.7 103.0<br />
Ma<strong>in</strong>land Europe 86.7 28.4 0.2 28.9<br />
North America 896.5 936.9 18.0 790.0<br />
Rest of World 59.1 3.3 – 4.0<br />
Total 1,183.0 1,183.0 22.9 925.9<br />
2009<br />
United K<strong>in</strong>gdom 125.1 191.5 4.0 104.6<br />
Ma<strong>in</strong>land Europe 81.3 29.0 0.2 31.5<br />
North America 814.4 857.1 23.6 788.3<br />
Rest of World 60.0 3.2 – 3.4<br />
Total 1,080.8 1,080.8 27.8 927.8<br />
An analysis of the Group’s revenue for the year is as follows:<br />
Total<br />
£m<br />
82.3<br />
9.3%<br />
Revenue from Revenue from<br />
sales of goods services<br />
£m £m £m £m<br />
<strong>2010</strong> 2009 <strong>2010</strong> 2009<br />
Flight Support 431.2 343.1 310.5 300.7<br />
Aftermarket Service and Systems 119.0 121.5 322.3 315.5<br />
550.2 464.6 632.8 616.2<br />
A portion of the Group’s revenue from the sale of goods and services denom<strong>in</strong>ated <strong>in</strong> foreign currencies is cash fow hedged. The amounts<br />
disclosed above for revenue from the sale of goods <strong>in</strong>clude the recycl<strong>in</strong>g of the efective amount of the foreign currency derivatives that are used<br />
to hedge foreign currency revenue. The amount <strong>in</strong>cluded <strong>in</strong> revenue is a loss of £3.6 million (2009: loss £5.5 million).