USPTO Performance and Accountability Report - U.S. Patent and ...
USPTO Performance and Accountability Report - U.S. Patent and ...
USPTO Performance and Accountability Report - U.S. Patent and ...

You also want an ePaper? Increase the reach of your titles
YUMPU automatically turns print PDFs into web optimized ePapers that Google loves.
112<br />
FINANCIAL SECTION<br />
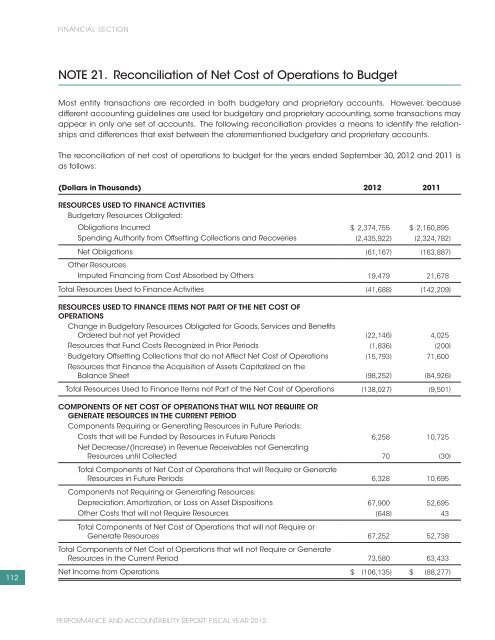
NOTE 21. Reconciliation of Net Cost of Operations to Budget<br />
Most entity transactions are recorded in both budgetary <strong>and</strong> proprietary accounts. However, because<br />
different accounting guidelines are used for budgetary <strong>and</strong> proprietary accounting, some transactions may<br />
appear in only one set of accounts. The following reconciliation provides a means to identify the relationships<br />
<strong>and</strong> differences that exist between the aforementioned budgetary <strong>and</strong> proprietary accounts.<br />
The reconciliation of net cost of operations to budget for the years ended September 30, 2012 <strong>and</strong> 2011 is<br />
as follows:<br />
(Dollars in Thous<strong>and</strong>s) 2012 2011<br />
RESOURCES USED TO FINANCE ACTIVITIES<br />
Budgetary Resources Obligated:<br />
Obligations Incurred $ 2,374,755 $ 2,160,895<br />
Spending Authority from Offsetting Collections <strong>and</strong> Recoveries (2,435,922) (2,324,782)<br />
Net Obligations<br />
Other Resources<br />
(61,167) (163,887)<br />
Imputed Financing from Cost Absorbed by Others 19,479 21,678<br />
Total Resources Used to Finance Activities (41,688) (142,209)<br />
RESOURCES USED TO FINANCE ITEMS NOT PART OF THE NET COST OF<br />
OPERATIONS<br />
Change in Budgetary Resources Obligated for Goods, Services <strong>and</strong> Benefits<br />
Ordered but not yet Provided (22,146) 4,025<br />
Resources that Fund Costs Recognized in Prior Periods (1,836) (200)<br />
Budgetary Offsetting Collections that do not Affect Net Cost of Operations<br />
Resources that Finance the Acquisition of Assets Capitalized on the<br />
(15,793) 71,600<br />
Balance Sheet (98,252) (84,926)<br />
Total Resources Used to Finance Items not Part of the Net Cost of Operations (138,027) (9,501)<br />
COMPONENTS OF NET COST OF OPERATIONS THAT WILL NOT REQUIRE OR<br />
GENERATE RESOURCES IN THE CURRENT PERIOD<br />
Components Requiring or Generating Resources in Future Periods:<br />
Costs that will be Funded by Resources in Future Periods<br />
Net Decrease/(Increase) in Revenue Receivables not Generating<br />
6,258 10,725<br />
Resources until Collected 70 (30)<br />
Total Components of Net Cost of Operations that will Require or Generate<br />
Resources in Future Periods 6,328 10,695<br />
Components not Requiring or Generating Resources:<br />
Depreciation, Amortization, or Loss on Asset Dispositions 67,900 52,695<br />
Other Costs that will not Require Resources (648) 43<br />
Total Components of Net Cost of Operations that will not Require or<br />
Generate Resources 67,252 52,738<br />
Total Components of Net Cost of Operations that will not Require or Generate<br />
Resources in the Current Period 73,580 63,433<br />
Net Income from Operations $ (106,135) $ (88,277)<br />
PERFORMANCE AND ACCOUNTABILITY REPORT: FISCAL YEAR 2012
![Printable version [PDF] - United States Patent and Trademark Office](https://img.yumpu.com/51835259/1/184x260/printable-version-pdf-united-states-patent-and-trademark-office.jpg?quality=85)