USPTO Performance and Accountability Report - U.S. Patent and ...
USPTO Performance and Accountability Report - U.S. Patent and ...
USPTO Performance and Accountability Report - U.S. Patent and ...

You also want an ePaper? Increase the reach of your titles
YUMPU automatically turns print PDFs into web optimized ePapers that Google loves.
76<br />
MANAGEMENT’S DISCUSSION AND ANALYSIS<br />
<strong>and</strong> account for most of the increase in total cost of<br />
Trademark operations during the past four years.<br />
This increase of $15.9 million was offset by other cost<br />
increases <strong>and</strong> decreases. Contractual services<br />
have decreased $3.5 million over the past four years,<br />
which represents the majority of the total Trademark<br />
cost change over the past four years, as a result of<br />
being able to rely more on automated tools, rather<br />
than contractors.<br />
The Intent-to-Use cost includes costs related to<br />
examining both the application <strong>and</strong> the additional<br />
intent to use disclosures. The overall cost percentages<br />
presented below are based on both direct<br />
costs <strong>and</strong> indirect costs allocated to trademark<br />
operations <strong>and</strong> are a function of the volume of<br />
applications processed in each product area.<br />
Intellectual Property Policy, Protection, <strong>and</strong><br />
Enforcement Worldwide<br />
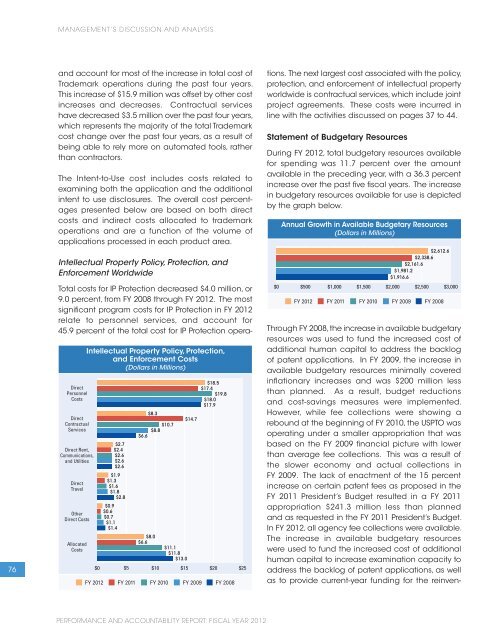
Total costs for IP Protection decreased $4.0 million, or<br />
9.0 percent, from FY 2008 through FY 2012. The most<br />
significant program costs for IP Protection in FY 2012<br />
relate to personnel services, <strong>and</strong> account for<br />
45.9 percent of the total cost for IP Protection opera-<br />
PERFORMANCE AND ACCOUNTABILITY REPORT: FISCAL YEAR 2012<br />
tions. The next largest cost associated with the policy,<br />
protection, <strong>and</strong> enforcement of intellectual property<br />
worldwide is contractual services, which include joint<br />
project agreements. These costs were incurred in<br />
line with the activities discussed on pages 37 to 44.<br />
Statement of Budgetary Resources<br />
During FY 2012, total budgetary resources available<br />
for spending was 11.7 percent over the amount<br />
available in the preceding year, with a 36.3 percent<br />
increase over the past five fiscal years. The increase<br />
in budgetary resources available for use is depicted<br />
by the graph below.<br />
Through FY 2008, the increase in available budgetary<br />
resources was used to fund the increased cost of<br />
additional human capital to address the backlog<br />
of patent applications. In FY 2009, the increase in<br />
available budgetary resources minimally covered<br />
inflationary increases <strong>and</strong> was $200 million less<br />
than planned. As a result, budget reductions<br />
<strong>and</strong> cost-savings measures were implemented.<br />
However, while fee collections were showing a<br />
rebound at the beginning of FY 2010, the <strong>USPTO</strong> was<br />
operating under a smaller appropriation that was<br />
based on the FY 2009 financial picture with lower<br />
than average fee collections. This was a result of<br />
the slower economy <strong>and</strong> actual collections in<br />
FY 2009. The lack of enactment of the 15 percent<br />
increase on certain patent fees as proposed in the<br />
FY 2011 President’s Budget resulted in a FY 2011<br />
appropriation $241.3 million less than planned<br />
<strong>and</strong> as requested in the FY 2011 President’s Budget.<br />
In FY 2012, all agency fee collections were available.<br />
The increase in available budgetary resources<br />
were used to fund the increased cost of additional<br />
human capital to increase examination capacity to<br />
address the backlog of patent applications, as well<br />
as to provide current-year funding for the reinven-
![Printable version [PDF] - United States Patent and Trademark Office](https://img.yumpu.com/51835259/1/184x260/printable-version-pdf-united-states-patent-and-trademark-office.jpg?quality=85)