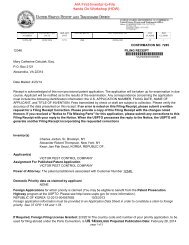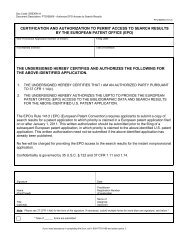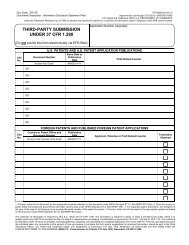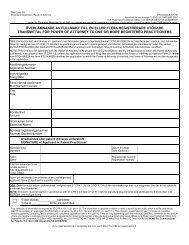
USPTO Performance and Accountability Report - U.S. Patent and ...
USPTO Performance and Accountability Report - U.S. Patent and ...
USPTO Performance and Accountability Report - U.S. Patent and ...

You also want an ePaper? Increase the reach of your titles
YUMPU automatically turns print PDFs into web optimized ePapers that Google loves.
70<br />
MANAGEMENT’S DISCUSSION AND ANALYSIS<br />
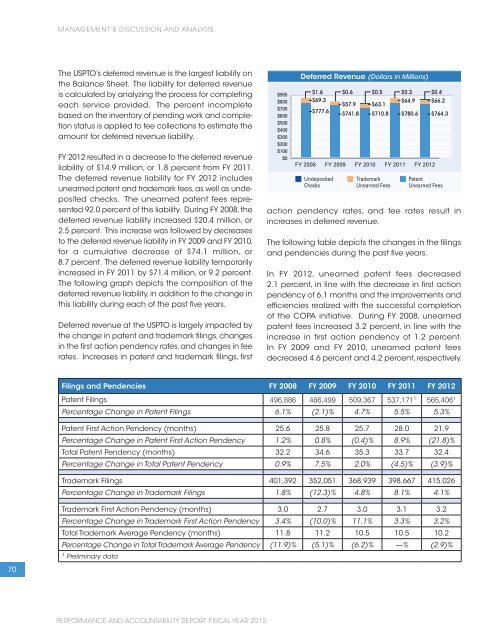
The <strong>USPTO</strong>’s deferred revenue is the largest liability on<br />
the Balance Sheet. The liability for deferred revenue<br />
is calculated by analyzing the process for completing<br />
each service provided. The percent incomplete<br />
based on the inventory of pending work <strong>and</strong> completion<br />
status is applied to fee collections to estimate the<br />
amount for deferred revenue liability.<br />
FY 2012 resulted in a decrease to the deferred revenue<br />
liability of $14.9 million, or 1.8 percent from FY 2011.<br />
The deferred revenue liability for FY 2012 includes<br />
unearned patent <strong>and</strong> trademark fees, as well as undeposited<br />
checks. The unearned patent fees represented<br />
92.0 percent of this liability. During FY 2008, the<br />
deferred revenue liability increased $20.4 million, or<br />
2.5 percent. This increase was followed by decreases<br />
to the deferred revenue liability in FY 2009 <strong>and</strong> FY 2010,<br />
for a cumulative decrease of $74.1 million, or<br />
8.7 percent. The deferred revenue liability temporarily<br />
increased in FY 2011 by $71.4 million, or 9.2 percent.<br />
The following graph depicts the composition of the<br />
deferred revenue liability, in addition to the change in<br />
this liability during each of the past five years.<br />
Deferred revenue at the <strong>USPTO</strong> is largely impacted by<br />
the change in patent <strong>and</strong> trademark filings, changes<br />
in the first action pendency rates, <strong>and</strong> changes in fee<br />
rates. Increases in patent <strong>and</strong> trademark filings, first<br />
action pendency rates, <strong>and</strong> fee rates result in<br />
increases in deferred revenue.<br />
The following table depicts the changes in the filings<br />
<strong>and</strong> pendencies during the past five years.<br />
In FY 2012, unearned patent fees decreased<br />
2.1 percent, in line with the decrease in first action<br />
pendency of 6.1 months <strong>and</strong> the improvements <strong>and</strong><br />
efficiencies realized with the successful completion<br />
of the COPA initiative. During FY 2008, unearned<br />
patent fees increased 3.2 percent, in line with the<br />
increase in first action pendency of 1.2 percent.<br />
In FY 2009 <strong>and</strong> FY 2010, unearned patent fees<br />
decreased 4.6 percent <strong>and</strong> 4.2 percent, respectively.<br />
Filings <strong>and</strong> Pendencies FY 2008 FY 2009 FY 2010 FY 2011 FY 2012<br />
<strong>Patent</strong> Filings 496,886 486,499 509,367 537,171 1 565,406 1<br />
Percentage Change in <strong>Patent</strong> Filings 6.1% (2.1)% 4.7% 5.5% 5.3%<br />
<strong>Patent</strong> First Action Pendency (months) 25.6 25.8 25.7 28.0 21.9<br />
Percentage Change in <strong>Patent</strong> First Action Pendency 1.2% 0.8% (0.4)% 8.9% (21.8)%<br />
Total <strong>Patent</strong> Pendency (months) 32.2 34.6 35.3 33.7 32.4<br />
Percentage Change in Total <strong>Patent</strong> Pendency 0.9% 7.5% 2.0% (4.5)% (3.9)%<br />
Trademark Filings 401,392 352,051 368,939 398,667 415,026<br />
Percentage Change in Trademark Filings 1.8% (12.3)% 4.8% 8.1% 4.1%<br />
Trademark First Action Pendency (months) 3.0 2.7 3.0 3.1 3.2<br />
Percentage Change in Trademark First Action Pendency 3.4% (10.0)% 11.1% 3.3% 3.2%<br />
Total Trademark Average Pendency (months) 11.8 11.2 10.5 10.5 10.2<br />
Percentage Change in Total Trademark Average Pendency (11.9)% (5.1)% (6.2)% —% (2.9)%<br />
1 Preliminary data<br />
PERFORMANCE AND ACCOUNTABILITY REPORT: FISCAL YEAR 2012
![Printable version [PDF] - United States Patent and Trademark Office](https://img.yumpu.com/51835259/1/184x260/printable-version-pdf-united-states-patent-and-trademark-office.jpg?quality=85)