USPTO Performance and Accountability Report - U.S. Patent and ...
USPTO Performance and Accountability Report - U.S. Patent and ...
USPTO Performance and Accountability Report - U.S. Patent and ...

You also want an ePaper? Increase the reach of your titles
YUMPU automatically turns print PDFs into web optimized ePapers that Google loves.
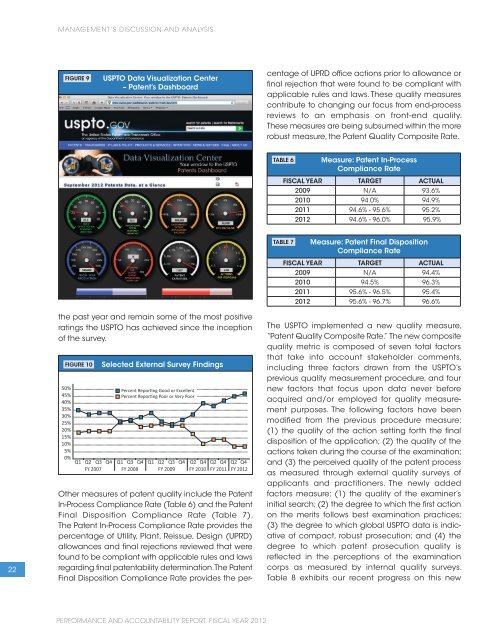
22<br />
MANAGEMENT’S DISCUSSION AND ANALYSIS<br />
FIGURE 9 <strong>USPTO</strong> Data Visualization Center<br />
– <strong>Patent</strong>’s Dashboard<br />
the past year <strong>and</strong> remain some of the most positive<br />
ratings the <strong>USPTO</strong> has achieved since the inception<br />
of the survey.<br />
FIGURE 10 Selected External Survey Findings<br />
Other measures of patent quality include the <strong>Patent</strong><br />
In-Process Compliance Rate (Table 6) <strong>and</strong> the <strong>Patent</strong><br />
Final Disposition Compliance Rate (Table 7).<br />
The <strong>Patent</strong> In-Process Compliance Rate provides the<br />
percentage of Utility, Plant, Reissue, Design (UPRD)<br />
allowances <strong>and</strong> final rejections reviewed that were<br />
found to be compliant with applicable rules <strong>and</strong> laws<br />
regarding final patentability determination. The <strong>Patent</strong><br />
Final Disposition Compliance Rate provides the per-<br />
PERFORMANCE AND ACCOUNTABILITY REPORT: FISCAL YEAR 2012<br />
centage of UPRD office actions prior to allowance or<br />
final rejection that were found to be compliant with<br />
applicable rules <strong>and</strong> laws. These quality measures<br />
contribute to changing our focus from end-process<br />
reviews to an emphasis on front-end quality.<br />
These measures are being subsumed within the more<br />
robust measure, the <strong>Patent</strong> Quality Composite Rate.<br />
TABLE 6 Measure: <strong>Patent</strong> In-Process<br />
Compliance Rate<br />
FISCAL YEAR TARGET ACTUAL<br />
2009 N/A 93.6%<br />
2010 94.0% 94.9%<br />
2011 94.6% - 95.6% 95.2%<br />
2012 94.6% - 96.0% 95.9%<br />
TABLE 7 Measure: <strong>Patent</strong> Final Disposition<br />
Compliance Rate<br />
FISCAL YEAR TARGET ACTUAL<br />
2009 N/A 94.4%<br />
2010 94.5% 96.3%<br />
2011 95.6% - 96.5% 95.4%<br />
2012 95.6% - 96.7% 96.6%<br />
The <strong>USPTO</strong> implemented a new quality measure,<br />
“<strong>Patent</strong> Quality Composite Rate.” The new composite<br />
quality metric is composed of seven total factors<br />
that take into account stakeholder comments,<br />
including three factors drawn from the <strong>USPTO</strong>’s<br />
previous quality measurement procedure, <strong>and</strong> four<br />
new factors that focus upon data never before<br />
acquired <strong>and</strong>/or employed for quality measurement<br />
purposes. The following factors have been<br />
modified from the previous procedure measure:<br />
(1) the quality of the action setting forth the final<br />
disposition of the application; (2) the quality of the<br />
actions taken during the course of the examination;<br />
<strong>and</strong> (3) the perceived quality of the patent process<br />
as measured through external quality surveys of<br />
applicants <strong>and</strong> practitioners. The newly added<br />
factors measure: (1) the quality of the examiner’s<br />
initial search; (2) the degree to which the first action<br />
on the merits follows best examination practices;<br />
(3) the degree to which global <strong>USPTO</strong> data is indicative<br />
of compact, robust prosecution; <strong>and</strong> (4) the<br />
degree to which patent prosecution quality is<br />
reflected in the perceptions of the examination<br />
corps as measured by internal quality surveys.<br />
Table 8 exhibits our recent progress on this new
![Printable version [PDF] - United States Patent and Trademark Office](https://img.yumpu.com/51835259/1/184x260/printable-version-pdf-united-states-patent-and-trademark-office.jpg?quality=85)