USPTO Performance and Accountability Report - U.S. Patent and ...
USPTO Performance and Accountability Report - U.S. Patent and ...
USPTO Performance and Accountability Report - U.S. Patent and ...

You also want an ePaper? Increase the reach of your titles
YUMPU automatically turns print PDFs into web optimized ePapers that Google loves.
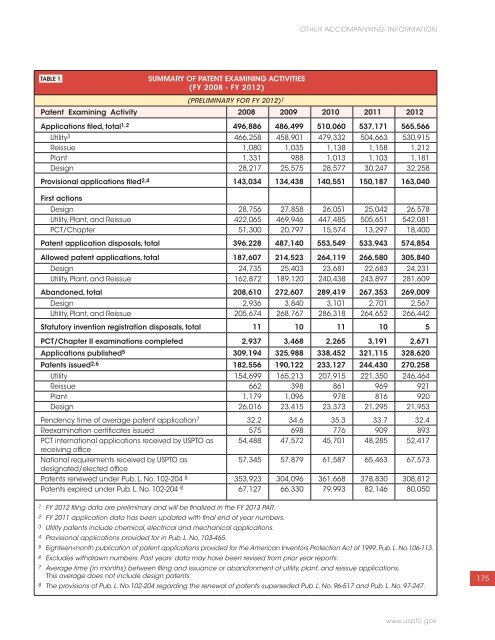
TABLE 1 SUMMARY OF PATENT EXAMINING ACTIVITIES<br />
(FY 2008 - FY 2012)<br />
(PRELIMINARY FOR FY 2012) 1<br />
<strong>Patent</strong> Examining Activity 2008 2009 2010 2011 2012<br />
Applications filed, total 1,2 496,886 486,499 510,060 537,171 565,566<br />
Utility 3 466,258 458,901 479,332 504,663 530,915<br />
Reissue 1,080 1,035 1,138 1,158 1,212<br />
Plant 1,331 988 1,013 1,103 1,181<br />
Design 28,217 25,575 28,577 30,247 32,258<br />
Provisional applications filed 2,4 143,034 134,438 140,551 150,187 163,040<br />
First actions<br />
OTHER ACCOMPANYING INFORMATION<br />
Design 28,756 27,858 26,051 25,042 26,578<br />
Utility, Plant, <strong>and</strong> Reissue 422,065 469,946 447,485 505,651 542,081<br />
PCT/Chapter 51,300 20,797 15,574 13,297 18,400<br />
<strong>Patent</strong> application disposals, total 396,228 487,140 553,549 533,943 574,854<br />
Allowed patent applications, total 187,607 214,523 264,119 266,580 305,840<br />
Design 24,735 25,403 23,681 22,683 24,231<br />
Utility, Plant, <strong>and</strong> Reissue 162,872 189,120 240,438 243,897 281,609<br />
Ab<strong>and</strong>oned, total 208,610 272,607 289,419 267,353 269,009<br />
Design 2,936 3,840 3,101 2,701 2,567<br />
Utility, Plant, <strong>and</strong> Reissue 205,674 268,767 286,318 264,652 266,442<br />
Statutory invention registration disposals, total 11 10 11 10 5<br />
PCT/Chapter II examinations completed 2,937 3,468 2,265 3,191 2,671<br />
Applications published 5 309,194 325,988 338,452 321,115 328,620<br />
<strong>Patent</strong>s issued 2,6 182,556 190,122 233,127 244,430 270,258<br />
Utility 154,699 165,213 207,915 221,350 246,464<br />
Reissue 662 398 861 969 921<br />
Plant 1,179 1,096 978 816 920<br />
Design 26,016 23,415 23,373 21,295 21,953<br />
Pendency time of average patent application7 32.2 34.6 35.3 33.7 32.4<br />
Reexamination certificates issued 575 698 776 909 893<br />
PCT international applications received by <strong>USPTO</strong> as<br />
receiving office<br />
54,488 47,572 45,701 48,285 52,417<br />
National requirements received by <strong>USPTO</strong> as<br />
designated/elected office<br />
57,345 57,879 61,587 65,463 67,573<br />
<strong>Patent</strong>s renewed under Pub. L. No. 102-204 8 353,923 304,096 361,668 378,830 308,812<br />
<strong>Patent</strong>s expired under Pub. L. No. 102-204 8 67,127 66,330 79,993 82,146 80,050<br />
1 FY 2012 filing data are preliminary <strong>and</strong> will be finalized in the FY 2013 PAR.<br />
2 FY 2011 application data has been updated with final end of year numbers.<br />
3 Utility patents include chemical, electrical <strong>and</strong> mechanical applications.<br />
4 Provisional applications provided for in Pub. L. No. 103-465.<br />
5 Eighteen-month publication of patent applications provided for the American Inventors Protection Act of 1999, Pub. L. No.106-113.<br />
6 Excludes withdrawn numbers. Past years’ data may have been revised from prior year reports.<br />
7 Average time (in months) between filing <strong>and</strong> issuance or ab<strong>and</strong>onment of utility, plant, <strong>and</strong> reissue applications.<br />
This average does not include design patents.<br />
8 The provisions of Pub. L. No.102-204 regarding the renewal of patents superseded Pub. L. No. 96-517 <strong>and</strong> Pub. L. No. 97-247.<br />
www.uspto.gov<br />
175
![Printable version [PDF] - United States Patent and Trademark Office](https://img.yumpu.com/51835259/1/184x260/printable-version-pdf-united-states-patent-and-trademark-office.jpg?quality=85)