USPTO Performance and Accountability Report - U.S. Patent and ...
USPTO Performance and Accountability Report - U.S. Patent and ...
USPTO Performance and Accountability Report - U.S. Patent and ...

Create successful ePaper yourself
Turn your PDF publications into a flip-book with our unique Google optimized e-Paper software.
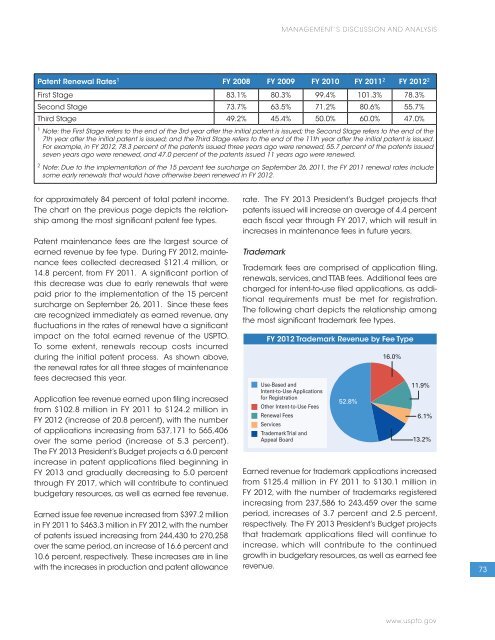
for approximately 84 percent of total patent income.<br />
The chart on the previous page depicts the relationship<br />
among the most significant patent fee types.<br />
<strong>Patent</strong> maintenance fees are the largest source of<br />
earned revenue by fee type. During FY 2012, maintenance<br />
fees collected decreased $121.4 million, or<br />
14.8 percent, from FY 2011. A significant portion of<br />
this decrease was due to early renewals that were<br />
paid prior to the implementation of the 15 percent<br />
surcharge on September 26, 2011. Since these fees<br />
are recognized immediately as earned revenue, any<br />
fluctuations in the rates of renewal have a significant<br />
impact on the total earned revenue of the <strong>USPTO</strong>.<br />
To some extent, renewals recoup costs incurred<br />
during the initial patent process. As shown above,<br />
the renewal rates for all three stages of maintenance<br />
fees decreased this year.<br />
Application fee revenue earned upon filing increased<br />
from $102.8 million in FY 2011 to $124.2 million in<br />
FY 2012 (increase of 20.8 percent), with the number<br />
of applications increasing from 537,171 to 565,406<br />
over the same period (increase of 5.3 percent).<br />
The FY 2013 President’s Budget projects a 6.0 percent<br />
increase in patent applications filed beginning in<br />
FY 2013 <strong>and</strong> gradually decreasing to 5.0 percent<br />
through FY 2017, which will contribute to continued<br />
budgetary resources, as well as earned fee revenue.<br />
Earned issue fee revenue increased from $397.2 million<br />
in FY 2011 to $463.3 million in FY 2012, with the number<br />
of patents issued increasing from 244,430 to 270,258<br />
over the same period, an increase of 16.6 percent <strong>and</strong><br />
10.6 percent, respectively. These increases are in line<br />
with the increases in production <strong>and</strong> patent allowance<br />
rate. The FY 2013 President’s Budget projects that<br />
patents issued will increase an average of 4.4 percent<br />
each fiscal year through FY 2017, which will result in<br />
increases in maintenance fees in future years.<br />
Trademark<br />
MANAGEMENT’S DISCUSSION AND ANALYSIS<br />
<strong>Patent</strong> Renewal Rates 1 FY 2008 FY 2009 FY 2010 FY 2011 2 FY 2012 2<br />
First Stage 83.1% 80.3% 99.4% 101.3% 78.3%<br />
Second Stage 73.7% 63.5% 71.2% 80.6% 55.7%<br />
Third Stage 49.2% 45.4% 50.0% 60.0% 47.0%<br />
1 Note: the First Stage refers to the end of the 3rd year after the initial patent is issued; the Second Stage refers to the end of the<br />
7th year after the initial patent is issued; <strong>and</strong> the Third Stage refers to the end of the 11th year after the initial patent is issued.<br />
For example, in FY 2012, 78.3 percent of the patents issued three years ago were renewed, 55.7 percent of the patents issued<br />
seven years ago were renewed, <strong>and</strong> 47.0 percent of the patents issued 11 years ago were renewed.<br />
2 Note: Due to the implementation of the 15 percent fee surcharge on September 26, 2011, the FY 2011 renewal rates include<br />
some early renewals that would have otherwise been renewed in FY 2012.<br />
Trademark fees are comprised of application filing,<br />
renewals, services, <strong>and</strong> TTAB fees. Additional fees are<br />
charged for intent-to-use filed applications, as additional<br />
requirements must be met for registration.<br />
The following chart depicts the relationship among<br />
the most significant trademark fee types.<br />
Earned revenue for trademark applications increased<br />
from $125.4 million in FY 2011 to $130.1 million in<br />
FY 2012, with the number of trademarks registered<br />
increasing from 237,586 to 243,459 over the same<br />
period, increases of 3.7 percent <strong>and</strong> 2.5 percent,<br />
respectively. The FY 2013 President’s Budget projects<br />
that trademark applications filed will continue to<br />
increase, which will contribute to the continued<br />
growth in budgetary resources, as well as earned fee<br />
revenue.<br />
www.uspto.gov<br />
73
![Printable version [PDF] - United States Patent and Trademark Office](https://img.yumpu.com/51835259/1/184x260/printable-version-pdf-united-states-patent-and-trademark-office.jpg?quality=85)