USPTO Performance and Accountability Report - U.S. Patent and ...
USPTO Performance and Accountability Report - U.S. Patent and ...
USPTO Performance and Accountability Report - U.S. Patent and ...

You also want an ePaper? Increase the reach of your titles
YUMPU automatically turns print PDFs into web optimized ePapers that Google loves.
14<br />
MANAGEMENT’S DISCUSSION AND ANALYSIS<br />
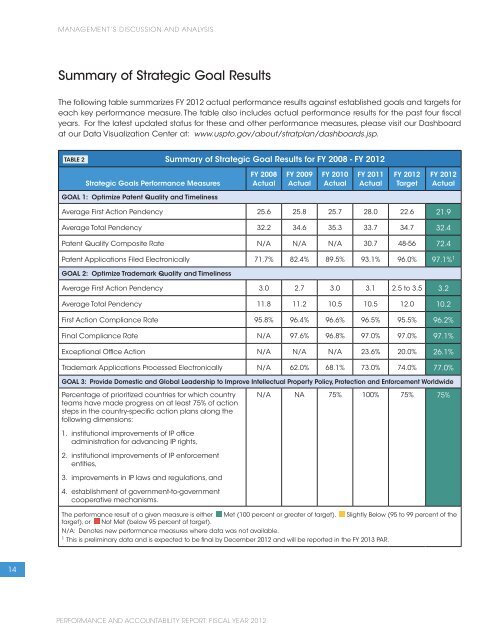
Summary of Strategic Goal Results<br />
The following table summarizes FY 2012 actual performance results against established goals <strong>and</strong> targets for<br />
each key performance measure. The table also includes actual performance results for the past four fiscal<br />
years. For the latest updated status for these <strong>and</strong> other performance measures, please visit our Dashboard<br />
at our Data Visualization Center at: www.uspto.gov/about/stratplan/dashboards.jsp.<br />
TABLE 2 Summary of Strategic Goal Results for FY 2008 - FY 2012<br />
Strategic Goals <strong>Performance</strong> Measures<br />
GOAL 1: Optimize <strong>Patent</strong> Quality <strong>and</strong> Timeliness<br />
FY 2008<br />
Actual<br />
FY 2009<br />
Actual<br />
FY 2010<br />
Actual<br />
FY 2011<br />
Actual<br />
FY 2012<br />
Target<br />
FY 2012<br />
Actual<br />
Average First Action Pendency 25.6 25.8 25.7 28.0 22.6 21.9<br />
Average Total Pendency 32.2 34.6 35.3 33.7 34.7 32.4<br />
<strong>Patent</strong> Quality Composite Rate N/A N/A N/A 30.7 48-56 72.4<br />
<strong>Patent</strong> Applications Filed Electronically 71.7% 82.4% 89.5% 93.1% 96.0% 97.1% 1<br />
GOAL 2: Optimize Trademark Quality <strong>and</strong> Timeliness<br />
Average First Action Pendency 3.0 2.7 3.0 3.1 2.5 to 3.5 3.2<br />
Average Total Pendency 11.8 11.2 10.5 10.5 12.0 10.2<br />
First Action Compliance Rate 95.8% 96.4% 96.6% 96.5% 95.5% 96.2%<br />
Final Compliance Rate N/A 97.6% 96.8% 97.0% 97.0% 97.1%<br />
Exceptional Office Action N/A N/A N/A 23.6% 20.0% 26.1%<br />
Trademark Applications Processed Electronically N/A 62.0% 68.1% 73.0% 74.0% 77.0%<br />
GOAL 3: Provide Domestic <strong>and</strong> Global Leadership to Improve Intellectual Property Policy, Protection <strong>and</strong> Enforcement Worldwide<br />
Percentage of prioritized countries for which country<br />
teams have made progress on at least 75% of action<br />
steps in the country-specific action plans along the<br />
following dimensions:<br />
1. institutional improvements of IP office<br />
administration for advancing IP rights,<br />
2. institutional improvements of IP enforcement<br />
entities,<br />
3. improvements in IP laws <strong>and</strong> regulations, <strong>and</strong><br />
4. establishment of government-to-government<br />
cooperative mechanisms.<br />
N/A NA 75% 100% 75% 75%<br />
The performance result of a given measure is either Met (100 percent or greater of target), Slightly Below (95 to 99 percent of the<br />
target), or Not Met (below 95 percent of target).<br />
N/A: Denotes new performance measures where data was not available.<br />
1 This is preliminary data <strong>and</strong> is expected to be final by December 2012 <strong>and</strong> will be reported in the FY 2013 PAR.<br />
PERFORMANCE AND ACCOUNTABILITY REPORT: FISCAL YEAR 2012
![Printable version [PDF] - United States Patent and Trademark Office](https://img.yumpu.com/51835259/1/184x260/printable-version-pdf-united-states-patent-and-trademark-office.jpg?quality=85)