GEO Chile 2005.pdf - Programa de Naciones Unidas para el Medio ...
GEO Chile 2005.pdf - Programa de Naciones Unidas para el Medio ...
GEO Chile 2005.pdf - Programa de Naciones Unidas para el Medio ...

You also want an ePaper? Increase the reach of your titles
YUMPU automatically turns print PDFs into web optimized ePapers that Google loves.
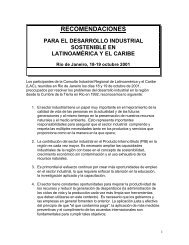
Figura 3.2 Distribución regional <strong>de</strong> bosque nativo por estructura a 1997.<br />
la XII, un 33,3 por ciento <strong>de</strong> la superficie regional<br />
(CONAF et al., 1999a).<br />
Miles <strong>de</strong> hectáreas<br />
2.500<br />
2.000<br />
1.500<br />
1.000<br />
500<br />
0<br />
V RM VI VII VIII IX X XI XII<br />
Fuente: Elaboración propia a partir <strong>de</strong> CONAF et al., (1999).<br />
Regiones<br />
BOSQUE ADULTO RENOVAL BOSQUE ADULTO RENOVAL BOSQUE ACHAPARRADO<br />
A niv<strong>el</strong> nacional, los tipos forestales predominantes son <strong>el</strong> Siemprever<strong>de</strong>,<br />
con un 30,9 por ciento, y la Lenga con un 25,3 por ciento,<br />
los que en conjunto ocupan más <strong>de</strong> la mitad <strong>de</strong> la superficie total <strong>de</strong><br />
bosque nativo <strong>de</strong>l país (Cuadro 3.3). A diferencia <strong>de</strong> estos, los tipos<br />
forestales Ciprés <strong>de</strong> la Cordillera, Roble - Hualo, Araucaria, y Alerce<br />
en conjunto abarcan sólo <strong>el</strong> 5,6 por ciento <strong>de</strong> la superficie total <strong>de</strong> los<br />
bosques nativos <strong>de</strong> <strong>Chile</strong>. En dicho Cuadro no aparece <strong>el</strong> tipo forestal<br />
Palma <strong>Chile</strong>na, ya que <strong>el</strong> pequeño tamaño <strong>de</strong> los bosquetes no permitió<br />
su cartografía a escala 1: 50.000.<br />
Miles <strong>de</strong> metros cúbicos<br />
Cuadro 3.3. Superficie <strong>de</strong> bosque nativo por tipo forestal a 1997<br />
4500<br />
4000<br />
3500<br />
3000<br />
2500<br />
2000<br />
3.2 CAUSAS Y CONDICIONANTES<br />
DEL ESTADO DE LOS BOSQUES<br />
NATIVOS<br />
3.2.1 Presión productiva<br />
3.2.1.1. Consumo industrial <strong>de</strong> ma<strong>de</strong>ra nativa<br />
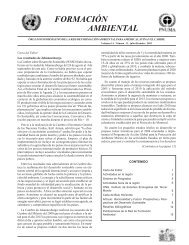
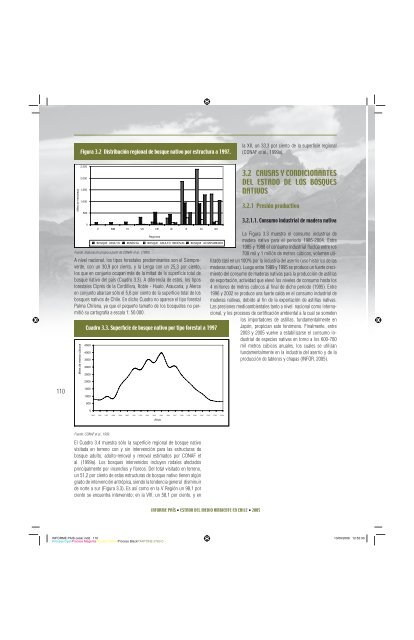
La Figura 3.3 muestra <strong>el</strong> consumo industrial <strong>de</strong><br />
ma<strong>de</strong>ra nativa <strong>para</strong> <strong>el</strong> periodo 1985-2004. Entre<br />
1985 y 1988 <strong>el</strong> consumo industrial fluctúa entre los<br />
700 mil y 1 millón <strong>de</strong> metros cúbicos, volumen utilizado<br />
casi en un 100% por la industria <strong>de</strong>l aserrío (uso histórico <strong>de</strong> las<br />
ma<strong>de</strong>ras nativas). Luego entre 1989 y 1995 se produce un fuerte crecimiento<br />
<strong>de</strong>l consumo <strong>de</strong> ma<strong>de</strong>ras nativas <strong>para</strong> la producción <strong>de</strong> astillas<br />
<strong>de</strong> exportación, actividad que <strong>el</strong>evó los niv<strong>el</strong>es <strong>de</strong> consumo hasta los<br />
4 millones <strong>de</strong> metros cúbicos al final <strong>de</strong> dicho período (1995). Entre<br />
1996 y 2002 se produce una fuerte caída en <strong>el</strong> consumo industrial <strong>de</strong><br />
ma<strong>de</strong>ras nativas, <strong>de</strong>bido al fin <strong>de</strong> la exportación <strong>de</strong> astillas nativas.<br />
Las presiones medioambientales tanto a niv<strong>el</strong> nacional como internacional,<br />
y los procesos <strong>de</strong> certificación ambiental a la cual se someten<br />
los importadores <strong>de</strong> astillas, fundamentalmente en<br />
Japón, propician este fenómeno. Finalmente, entre<br />
2003 y 2005 vu<strong>el</strong>ve a estabilizarse <strong>el</strong> consumo industrial<br />
<strong>de</strong> especies nativas en torno a los 600-700<br />
mil metros cúbicos anuales, los cuales se utilizan<br />
fundamentalmente en la industria <strong>de</strong>l aserrío y <strong>de</strong> la<br />
producción <strong>de</strong> tableros y chapas (INFOR, 2005).<br />
110<br />
1500<br />
1000<br />
500<br />
0<br />
1985 1986 1987 1988 1989 1990 1991 1992 1993 1994 1995 1996 1997 1998 1999 2000 2001 2002 2003 2004<br />
Años<br />
Fuente: CONAF et al., 1999.<br />
El Cuadro 3.4 muestra sólo la superficie regional <strong>de</strong> bosque nativo<br />
visitada en terreno con y sin intervención <strong>para</strong> las estructuras <strong>de</strong><br />
bosque adulto, adulto-renoval y renoval estimados por CONAF et<br />
al. (1999a). Los bosques intervenidos incluyen rodales afectados<br />
principalmente por incendios y floreos. D<strong>el</strong> total visitado en terreno,<br />
un 51,2 por ciento <strong>de</strong> estas estructuras <strong>de</strong> bosque nativo tienen algún<br />
grado <strong>de</strong> intervención antrópica, siendo la ten<strong>de</strong>ncia general disminuir<br />
<strong>de</strong> norte a sur (Figura 3.3). Es así como en la V Región un 98,1 por<br />
ciento se encuentra intervenido; en la VIII, un 58,1 por ciento, y en<br />
INFORME PAÍS • ESTADO DEL MEDIO AMBIENTE EN CHILE • 2005<br />
INFORME PAIS cesar.indd 110 13/09/2006 12:52:33<br />
Process CyanProcess MagentaProcess Y<strong>el</strong>lowProcess BlackPANTONE 5763 C