GEO Chile 2005.pdf - Programa de Naciones Unidas para el Medio ...
GEO Chile 2005.pdf - Programa de Naciones Unidas para el Medio ...
GEO Chile 2005.pdf - Programa de Naciones Unidas para el Medio ...

Create successful ePaper yourself
Turn your PDF publications into a flip-book with our unique Google optimized e-Paper software.
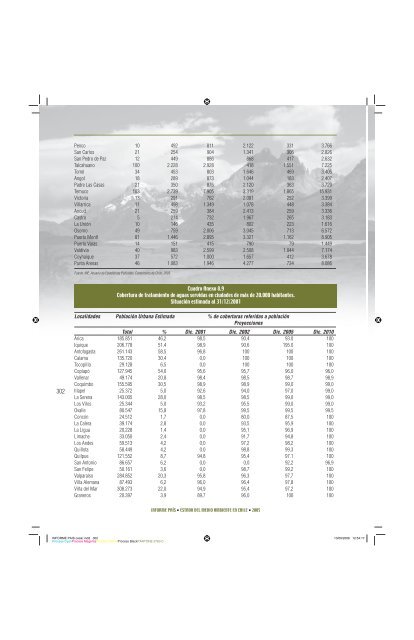
Penco 10 492 811 2.122 331 3.766<br />
San Carlos 21 254 904 1.341 306 2.826<br />
San Pedro <strong>de</strong> Paz 12 449 886 868 417 2.632<br />
Talcahuano 100 2.228 2.928 418 1.551 7.225<br />
Tomé 34 453 803 1.646 469 3.405<br />
Angol 18 289 873 1.044 183 2.407<br />
Padre Las Casas 21 350 875 2.120 363 3.729<br />
Temuco 103 2.739 7.905 3.319 1.865 15.931<br />
Victoria 13 291 762 2.081 252 3.399<br />
Villarrica 11 498 1.349 1.078 448 3.384<br />
Ancud 21 259 384 2.413 259 3.336<br />
Castro 5 214 732 1.967 265 3.183<br />
La Unión 10 146 435 802 223 1.616<br />
Osorno 49 759 2.006 3.045 713 6.572<br />
Puerto Montt 81 1.446 2.895 3.321 1.162 8.905<br />
Puerto Varas 14 151 415 790 79 1.449<br />
Valdivia 40 983 2.599 2.508 1.044 7.174<br />
Coyhaique 37 572 1.000 1.657 412 3.678<br />
Punta Arenas 46 1.083 1.946 4.277 734 8.086<br />
Fuente: INE. Anuario <strong>de</strong> Estadísticas Policiales. Carabineros <strong>de</strong> <strong>Chile</strong>, 2003.<br />
Cuadro Anexo 8.9<br />
Cobertura <strong>de</strong> tratamiento <strong>de</strong> aguas servidas en ciuda<strong>de</strong>s <strong>de</strong> más <strong>de</strong> 20.000 habitantes.<br />
Situación estimada al 31/12/2001<br />
302<br />
Localida<strong>de</strong>s Población Urbana Estimada % <strong>de</strong> coberturas referidas a población<br />
Proyecciones<br />
Total % Dic. 2001 Dic. 2002 Dic. 2005 Dic. 2010<br />
Arica 185.851 46,2 98,5 90,4 93.0 100<br />
Iquique 206.778 51,4 98,9 90,6 195.0 100<br />
Antofagasta 261.143 58,5 96,8 100 100 100<br />
Calama 135.720 30,4 0,0 100 100 100<br />
Tocopilla 29.128 6,5 0,0 100 100 100<br />
Copiapó 127.945 54,0 95,6 95,7 96,0 96,0<br />
Vallenar 49.174 20,8 98,4 98,5 98,7 98,9<br />
Coquimbo 155.595 30,5 98,9 98,9 99,0 99,0<br />
Illap<strong>el</strong> 25.372 5,0 92,6 94,0 97,0 99,0<br />
La Serena 143.005 28,0 98,5 98,5 99,0 99,0<br />
Los Vilos 25.344 5,0 93,2 95,5 99,0 99,0<br />
Ovalle 80.547 15,8 97,8 99,5 99,5 99,5<br />
Concón 24.512 1,7 0,0 80,0 87,5 100<br />
La Calera 39.174 2,8 0,0 93,5 95,9 100<br />
La Ligua 20,228 1,4 0,0 95,1 96,9 100<br />
Limache 33.050 2,4 0,0 91,7 94,8 100<br />
Los An<strong>de</strong>s 59.513 4,2 0,0 97,2 98,2 100<br />
Quillota 58.449 4,2 0.0 98,8 99,3 100<br />
Quilpue 121.552 8,7 94,8 95,4 97.1 100<br />
San Antonio 86.657 6,2 0,0 0,0 92,2 96,9<br />
San F<strong>el</strong>ipe 50.161 3,6 0,0 98,7 99,2 100<br />
Val<strong>para</strong>íso 284.852 20,3 95,8 96,3 97,7 100<br />
Villa Alemana 87.493 6,2 96,0 96,4 97,8 100<br />
Viña <strong>de</strong>l Mar 308.273 22,0 94,9 95,4 97,2 100<br />
Graneros 20.397 3,9 89,7 96,0 100 100<br />
INFORME PAÍS • ESTADO DEL MEDIO AMBIENTE EN CHILE • 2005<br />
INFORME PAIS cesar.indd 302 13/09/2006 12:54:17<br />
Process CyanProcess MagentaProcess Y<strong>el</strong>lowProcess BlackPANTONE 5763 C