GEO Chile 2005.pdf - Programa de Naciones Unidas para el Medio ...
GEO Chile 2005.pdf - Programa de Naciones Unidas para el Medio ...
GEO Chile 2005.pdf - Programa de Naciones Unidas para el Medio ...

You also want an ePaper? Increase the reach of your titles
YUMPU automatically turns print PDFs into web optimized ePapers that Google loves.
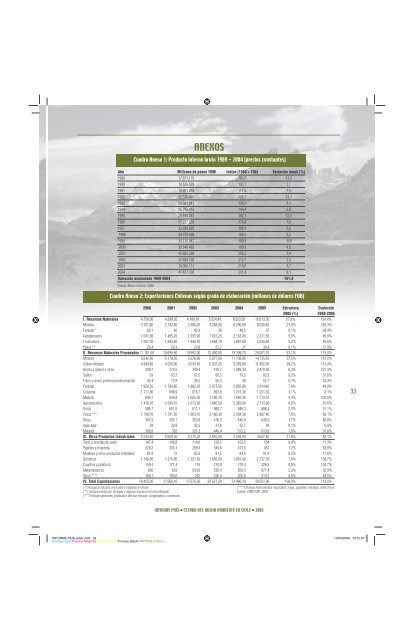
ANEXOS<br />
Cuadro Anexo 1: Producto interno bruto 1989 - 2004 (precios constantes)<br />
Año Millones <strong>de</strong> pesos 1996 Indice (1989 = 100) Variación anual (%)<br />
1989 17.871.170 100,0 11,5<br />
1990 18.526.529 103,7 3,7<br />
1991 19.921.495 111,5 7,5<br />
1992 22.528.491 126,1 13,1<br />
1993 24.361.841 136,3 8,1<br />
1994 25.798.410 144,4 5,9<br />
1995 28.976.743 162,1 12,3<br />
1996 31.237.289 174,8 7,8<br />
1997 33.300.693 186,3 6,6<br />
1998 34.376.598 192,4 3,2<br />
1999 34.115.042 190,9 -0,8<br />
2000 35.646.492 199,5 4,5<br />
2001 36.850.288 206,2 3,4<br />
2002 37.655.139 210,7 2,2<br />
2003 39.060.131 218,6 3,7<br />
2004 41.427.296 231,8 6,1<br />
Variación acumulada 1989-2004 131,8<br />
Fuente: Banco Central, 2005.<br />
Cuadro Anexo 2: Exportaciones <strong>Chile</strong>nas según grado <strong>de</strong> <strong>el</strong>aboración (millones <strong>de</strong> dólares FOB)<br />
2000 2001 2002 2003 2004 2005 Estructura Evolución<br />
2005 (%) 2000-2005<br />
I. Recursos Naturales 4.730,00 4.299,20 4.109,10 5.224,40 8.523,50 10.613,30 27,0% 124,4%<br />
Minería 3.101,80 2.742,60 2.386,20 3.258,00 6.290,60 8.228,40 21,0% 165,3%<br />
Forestal * 60,1 45 43,3 38 48,5 37 0,1% -38,4%<br />
Agropecuario 1.541,60 1.485,20 1.655,90 1.901,20 2.153,40 2.311,50 5,9% 49,9%<br />
Fruticultura 1.297,00 1.260,60 1.446,40 1.658,10 1.891,00 2.030,80 5,2% 56,6%<br />
Pesca ** 26,4 26,3 23,8 27,2 31 36,4 0,1% 37,9%<br />
II. Recursos Naturales Procesados 11.161,60 10.699,60 10.992,00 12.450,00 19.398,70 24.001,10 61,1% 115,0%<br />
Minería 5.642,50 5.178,50 5.278,80 5.877,00 11.108,90 14.735,50 37,5% 161,2%<br />
Cobre refi nado 4.948,40 4.530,00 4.539,40 5.007,20 9.359,80 11.452,60 29,2% 131,4%<br />
Hierro a gran<strong>el</strong> y otros 299,7 274,5 349,4 410,7 1.089,30 2.479,50 6,3% 727,3%<br />
Salitre 63 63,7 67,5 66,3 79,5 82,9 0,2% 31,6%<br />
Fierro y acero primera transformación 42,4 17,9 39,2 50,3 38 52,7 0,1% 24,3%<br />
Forestal 1.956,50 1.784,80 1.882,20 2.073,90 2.855,80 2.914,40 7,4% 49,0%<br />
C<strong>el</strong>ulosa 1.111,80 848,9 816,7 893,9 1.215,30 1.201,30 3,1% 8,1%<br />
Ma<strong>de</strong>ra 844,7 935,8 1.065,50 1.180,10 1.640,40 1.713,10 4,4% 102,8%<br />
Agroindustria 1.416,10 1.549,10 1.573,90 1.840,50 2.383,90 2.713,90 6,9% 91,6%<br />
Vinos 586,7 601,6 611,1 680,7 846,3 886,4 2,3% 51,1%<br />
Pesca *** 1.798,70 1.791,50 1.903,10 2.180,30 2.504,30 2.987,40 7,6% 66,1%<br />
Otros 347,9 395,7 353,8 478,3 545,9 649,9 1,7% 86,8%<br />
Agar-agar 39 33,8 32,5 31,8 32,7 39 0,1% 0,0%<br />
Metanol 308,9 362 321,3 446,4 513,2 610,9 1,6% 97,8%<br />
III. Otros Productos Industriales 2.533,40 2.669,30 2.575,20 2.952,80 3.538,00 4.637,40 11,8% 83,1%<br />
Textil y prendas <strong>de</strong> vestir 147,4 142,8 114,6 128,3 162,5 164 0,4% 11,3%<br />
Pap<strong>el</strong>es e Imprenta 329,2 334,1 299,4 340,8 413,5 457 1,2% 38,8%<br />
Muebles y otros productos forestales 81,9 72 83,9 81,5 84,5 91,4 0,2% 11,6%<br />
Químicos 1.146,80 1.276,80 1.221,50 1.630,40 1.961,40 2.737,30 7,0% 138,7%<br />
Cauchos y plásticos 159,4 171,4 176 210,9 270,3 326,3 0,8% 104,7%<br />
Metalmecánico 660 653 593,9 535,4 650,3 877,4 2,2% 32,9%<br />
Otros **** 168,1 190,6 262 236,4 265,8 310,3 0,8% 84,6%<br />
IV. Total Exportaciones 18.425,00 17.668,10 17.676,30 20.627,20 31.460,10 39.251,90 100,0% 113,0%<br />
(*) Incluye productos silvícolas y ma<strong>de</strong>ras en bruto.<br />
(**) Incluye extracción <strong>de</strong> algas y algunos peces en forma artesanal.<br />
(***) Incluye salmones, productos <strong>de</strong>l mar frescos, cong<strong>el</strong>ados y conservas.<br />
(****) Incluye Instrumentos musicales, joyas, juguetes, menajes, entre otros.<br />
Fuente: DIRECON, 2005.<br />
33<br />
INFORME PAÍS • ESTADO DEL MEDIO AMBIENTE EN CHILE • 2005<br />
INFORME PAIS cesar.indd 33 13/09/2006 12:51:57<br />
Process CyanProcess MagentaProcess Y<strong>el</strong>lowProcess BlackPANTONE 5763 C