GEO Chile 2005.pdf - Programa de Naciones Unidas para el Medio ...
GEO Chile 2005.pdf - Programa de Naciones Unidas para el Medio ...
GEO Chile 2005.pdf - Programa de Naciones Unidas para el Medio ...

Create successful ePaper yourself
Turn your PDF publications into a flip-book with our unique Google optimized e-Paper software.
Ton<strong>el</strong>adas anuales <strong>de</strong> Azufre<br />
Fundición <strong>de</strong> Chuquicamata II Región (CODELCO)<br />
700.000<br />
600.000<br />
Plan Desc.<br />
500.000<br />
S ingresado<br />
400.000<br />
S Emitido<br />
300.000<br />
200.000<br />
S Fijado<br />
Ton<strong>el</strong>adas Anuales <strong>de</strong> Azufre<br />
70.000<br />
60.000<br />
50.000<br />
40.000<br />
30.000<br />
20.000<br />
Fundición Paipote III Región (ENAMI)<br />
Plan Desc.<br />
S Ingresado<br />
S Emitido<br />
S Fijado<br />
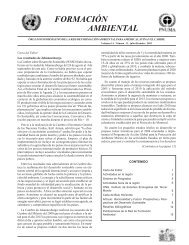
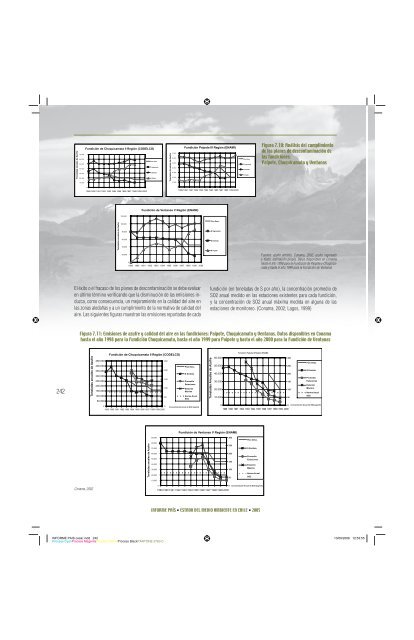
Figura 7.10: Análisis <strong>de</strong>l cumplimiento<br />
<strong>de</strong> los planes <strong>de</strong> <strong>de</strong>scontaminación <strong>de</strong><br />
las fundiciones:<br />
Paipote, Chuquicamata y Ventanas<br />
100.000<br />
10.000<br />
0<br />
0<br />
1989 1990 1991 1992 1993 1994 1995 1996 1997 1998 1999 2000<br />
1989 1990 1991 1992 1993 1994 1995 1996 1997 1998 1999 2000<br />
Fundición <strong>de</strong> Ventanas V Región (ENAMI)<br />
120.000<br />
Plan Desc.<br />
Ton<strong>el</strong>adas anuales <strong>de</strong> Azufre<br />
100.000<br />
80.000<br />
60.000<br />
40.000<br />
20.000<br />
0<br />
1989 1990 1991 1992 1993 1994 1995 1996 1997 1998 1999 2000<br />
S Ingresado<br />
S Emitido<br />
S Fijado<br />
Fuentes: azufre emitido, Conama, 2002; azufre ingresado<br />
y fi jado, estimación propia. Datos disponibles en Conama<br />
hasta <strong>el</strong> año 1998 <strong>para</strong> la Fundición <strong>de</strong> Paipote y Chuquicamata<br />
y hasta <strong>el</strong> año 1999 <strong>para</strong> la Fundición <strong>de</strong> Ventanas<br />
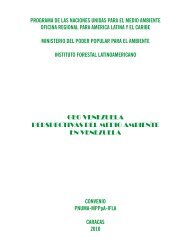
El éxito o <strong>el</strong> fracaso <strong>de</strong> los planes <strong>de</strong> <strong>de</strong>scontaminación se <strong>de</strong>be evaluar<br />
en último término verifi cando que la disminución <strong>de</strong> las emisiones induzca,<br />
como consecuencia, un mejoramiento en la calidad <strong>de</strong>l aire en<br />
las zonas aledañas y a un cumplimiento <strong>de</strong> la normativa <strong>de</strong> calidad <strong>de</strong>l<br />
aire. Las siguientes fi guras muestran las emisiones reportadas <strong>de</strong> cada<br />
fundición (en ton<strong>el</strong>adas <strong>de</strong> S por año), la concentración promedio <strong>de</strong><br />
SO2 anual medido en las estaciones existentes <strong>para</strong> cada fundición,<br />
y la concentración <strong>de</strong> SO2 anual máxima medida en alguna <strong>de</strong> las<br />
estaciones <strong>de</strong> monitoreo. (Conama, 2002; Lagos, 1999)<br />
Figura 7.11: Emisiones <strong>de</strong> azufre y calidad <strong>de</strong>l aire en las fundiciones: Paipote, Chuquicamata y Ventanas. Datos disponibles en Conama<br />
hasta <strong>el</strong> año 1998 <strong>para</strong> la Fundición Chuquicamata, hasta <strong>el</strong> año 1999 <strong>para</strong> Paipote y hasta <strong>el</strong> año 2000 <strong>para</strong> la Fundición <strong>de</strong> Ventanas<br />
242<br />
Ton<strong>el</strong>adas anuales <strong>de</strong> Azufre<br />
Fundición <strong>de</strong> Chuquicamata II Región (CODELCO)<br />
450.000<br />
250<br />
400.000<br />
Plan Desc.<br />
350.000<br />
200<br />
S Emitido<br />
300.000<br />
150<br />
250.000<br />
Promedio<br />
Estaciones<br />
200.000<br />
100<br />
Estación<br />
150.000<br />
Máxima<br />
100.000<br />
Norma Anual<br />
50<br />
SO2<br />
50.000<br />
0<br />
0 Concentración Anual <strong>de</strong> SO2 [ug/m3]<br />
1989 1990 1991 1992 1993 1994 1995 1996 1997 1998 1999 2000<br />
Ton<strong>el</strong>adas Anuales <strong>de</strong> Azufre<br />
Fundición Paipote III Región (ENAMI)<br />
60.000<br />
300<br />
Plan Desc.<br />
50.000<br />
250<br />
S Emitido<br />
40.000<br />
200<br />
30.000<br />
20.000<br />
150<br />
100<br />
Promedio<br />
Estaciones<br />
Estación<br />
Máxima<br />
Norma Anual<br />
SO2<br />
10.000<br />
50<br />
0<br />
0 Concentración Anual <strong>de</strong> SO2 [ug/m3]<br />
1989 1990 1991 1992 1993 1994 1995 1996 1997 1998 1999 2000<br />
Ton<strong>el</strong>adas anuales <strong>de</strong> Azufre<br />
90.000<br />
80.000<br />
70.000<br />
60.000<br />
50.000<br />
40.000<br />
30.000<br />
20.000<br />
10.000<br />
Fundición <strong>de</strong> Ventanas V Región (ENAMI)<br />
300<br />
250<br />
200<br />
150<br />
100<br />
50<br />
Plan Desc.<br />
S Emitido<br />
Promedio<br />
Estaciones<br />
Estación<br />
Máxima<br />
Norma Anual<br />
SO2<br />
Conama, 2002<br />
0<br />
0 Concentración Anual <strong>de</strong> SO2 [ug/m3]<br />
1989 1990 1991 1992 1993 1994 1995 1996 1997 1998 1999 2000<br />
INFORME PAÍS • ESTADO DEL MEDIO AMBIENTE EN CHILE • 2005<br />
INFORME PAIS cesar.indd 242 13/09/2006 12:53:55<br />
Process CyanProcess MagentaProcess Y<strong>el</strong>lowProcess BlackPANTONE 5763 C