anuario de estadÃsticas del cobre y otros minerales - Comisión ...
anuario de estadÃsticas del cobre y otros minerales - Comisión ...
anuario de estadÃsticas del cobre y otros minerales - Comisión ...
- No tags were found...
Create successful ePaper yourself
Turn your PDF publications into a flip-book with our unique Google optimized e-Paper software.
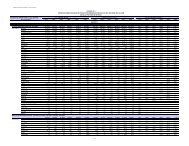
TABLA / TABLE 69INVERSIÓN EXTRANJERA MATERIALIZADA EN MINERÍA EN CHILE SEGÚN DL - 600 POR REGIONESActual Mining FDI Un<strong>de</strong>r Decree-Law 600, Shown by Region(Millones <strong>de</strong> US$ <strong>de</strong> cada año) / (US$ Mn of Each Year)REGIÓN 1974-1999 2000 2001 2002 2003 2004 2005 2006 2007(1) 2008(1) TOTALXV 2.286,2 0,0 0,0 90,6 181,2 98,9 2,3 3,2 3,4 3,6 2.669,4I 658,9 2,7 18,0 0,8 3,1 2,8 0,3 9,4 10,2 4,1 710,3II 5.504,4 62,3 1.017,1 623,3 145,5 135,5 399,2 257,7 91,7 702,1 8.938,8III 1.532,8 50,1 71,7 103,4 17,7 39,3 61,3 667,6 50,4 1.505,5 4.099,8IV 1.636,2 78,8 0,0 18,0 21,6 18,4 8,8 5,3 0,1 9,2 1.796,4V 0,6 0,0 0,0 0,0 0,9 4,9 0,2 0,0 0,5 2,5 9,6VI 14,4 0,0 0,0 0,0 0,0 0,0 0,0 0,0 0,0 0,0 14,4VII 0,2 0,0 0,0 0,0 0,0 0,0 0,0 0,0 0,0 0,0 0,2VIII 0,1 0,1 0,0 0,0 0,0 0,0 0,0 0,0 0,0 0,0 0,2IX 1,4 0,0 0,0 0,0 0,0 0,0 0,0 0,0 0,0 0,0 1,4XIV 2,0 0,0 0,0 0,0 0,0 0,0 0,0 0,0 0,0 0,0 2,0X 0,0 0,0 0,0 0,0 0,0 0,0 0,0 0,0 0,0 0,0 0,0XI 105,7 7,1 3,0 3,3 6,0 5,2 2,7 0,0 0,0 0,0 133,0XII 4,1 0,0 0,0 0,0 0,0 0,0 0,0 0,0 0,0 0,0 4,1R. METROPOLITANA /METROPOLITAN REGION2.704,7 1,8 1,0 1.135,0 1,6 34,0 86,0 5,0 0,0 120,0 4.089,1MULTI-REGION (2) 586,5 30,8 25,4 28,7 14,6 10,7 27,9 178,1 148,0 19,2 1.069,9PAÍS / COUNTRY 15.038,2 233,7 1.136,2 2.003,1 392,2 349,7 588,7 1.126,3 304,3 2.366,2 23.538,6PARTICIPACIÓN REGIONAL EN LA INVERSIÓN EXTRANJERA MATERIALIZADA EN MINERÍA SEGÚN DL - 600Share of Actual Mining FDI Un<strong>de</strong>r Decree-Law 600, Shown by Region(%)REGIÓN 1974-1999 2000 2001 2002 2003 2004 2005 2006 2007(1) 2008(1) TOTALXV 15,2 0,0 0,0 4,5 46,2 28,3 0,4 0,3 1,1 0,2 11,3I 4,4 1,2 1,6 0,0 0,8 0,8 0,1 0,8 3,4 0,2 3,0II 36,6 26,7 89,5 31,1 37,1 38,7 67,8 22,9 30,1 29,7 38,0III 10,2 21,4 6,3 5,2 4,5 11,2 10,4 59,3 16,6 63,6 17,4IV 10,9 33,7 0,0 0,9 5,5 5,3 1,5 0,5 0,0 0,4 7,6V 0,0 0,0 0,0 0,0 0,2 1,4 0,0 0,0 0,2 0,1 0,0VI 0,1 0,0 0,0 0,0 0,0 0,0 0,0 0,0 0,0 0,0 0,1VII 0,0 0,0 0,0 0,0 0,0 0,0 0,0 0,0 0,0 0,0 0,0VIII 0,0 0,0 0,0 0,0 0,0 0,0 0,0 0,0 0,0 0,0 0,0IX 0,0 0,0 0,0 0,0 0,0 0,0 0,0 0,0 0,0 0,0 0,0XIV 0,0 0,0 0,0 0,0 0,0 0,0 0,0 0,0 0,0 0,0 0,0X 0,0 0,0 0,0 0,0 0,0 0,0 0,0 0,0 0,0 0,0 0,0XI 0,7 3,0 0,3 0,2 1,5 1,5 0,5 0,0 0,0 0,0 0,6XII 0,0 0,0 0,0 0,0 0,0 0,0 0,0 0,0 0,0 0,0 0,0R. METROPOLITANA /METROPOLITAN REGION18,0 0,8 0,1 56,7 0,4 9,7 14,6 0,4 0,0 5,1 17,4MULTI-REGION (2) 3,9 13,2 2,2 1,4 3,7 3,1 4,7 15,8 48,6 0,8 4,5PAÍS / COUNTRY 100,0 100,0 100,0 100,0 100,0 100,0 100,0 100,0 100,0 100,0 100,0(1) Cifras provisionales. / Estimated.(2) Incluye inversión en más <strong>de</strong> una región y la no clasificada. / Inclu<strong>de</strong>s investment in more than one region and unclassified investment.Fuente / Source: Comité <strong>de</strong> Inversiones Extranjeras / Foreign Investment Committee.COCHILCO123


