anuario de estadÃsticas del cobre y otros minerales - Comisión ...
anuario de estadÃsticas del cobre y otros minerales - Comisión ...
anuario de estadÃsticas del cobre y otros minerales - Comisión ...
- No tags were found...
You also want an ePaper? Increase the reach of your titles
YUMPU automatically turns print PDFs into web optimized ePapers that Google loves.
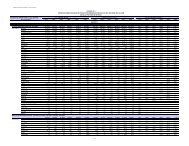
TABLA / TABLE 93EXPORTACIONES MUNDIALES DE COBRE POR PRODUCTOSGlobal Copper Exports By Product Type(Miles <strong>de</strong> TM <strong>de</strong> <strong>cobre</strong> fino) / (kMT Copper Content)1999 2000 2001 2002 2003 2004 2005 2006 2007 2008 (p)A. REFINADO / RefinedChile 2.553,8 2.549,2 2.696,4 2.767,2 2.614,1 2.953,9 2.799,3 2.605,8 2.909,7 2.983,1Zambia 205,9 216,6 307,8 339,3 363,1 393,2 423,0 476,1 490,9 585,2Japón /Japan 318,4 299,4 416,0 377,9 289,8 194,6 247,7 319,8 428,1 423,5Perú / Peru 415,8 376,5 432,8 415,1 458,6 317,7 513,7 448,7 364,6 418,6Australia 254,0 323,4 397,0 363,8 323,0 322,9 315,4 286,5 295,0 356,5Kazakhstan / Kazakhstan 354,0 392,5 398,9 391,4 375,7 390,6 401,2 356,6 348,5Polonia /Poland 221,0 240,3 226,9 262,5 283,5 280,4 290,5 287,7 239,5 296,7Canadá /Canada 294,1 288,9 309,7 241,5 221,7 289,0 297,0 279,5 297,7 290,0Bélgica /Belgium 171,9 199,1 241,0 201,4 336,6 169,6 241,4 236,8 201,3 260,1Rusia / Russia 633,6 650,4 650,6 505,2 396,8 359,4 300,7 261,8 274,6 206,9Filipinas / Philippines 142,7 128,8 156,9 142,6 167,4 159,4 113,7 176,9 181,5 181,5India 0,1 29,5 37,6 89,4 105,4 124,9 148,6 235,8 215,4 155,1 (1)Indonesia 78,7 131,5 164,3 134,2 196,0 88,4 280,1 110,9 168,8 143,3Corea <strong>de</strong>l sur/ South Korea 148,6 27,1 8,2 14,9 42,2 46,7 86,6 143,9 139,8 127,5Alemania / Germany 140,2 94,1 108,2 90,9 117,6 137,2 149,1 146,1 117,4 125,0Austria 90,8 104,5 84,9 74,4 81,8 71,1 83,3 84,1 82,7 115,0China 94,6 114,5 51,0 76,6 64,4 123,8 140,2 243,0 125,9 96,1Bulgaria 18,1 27,4 30,7 40,9 42,6 48,2 40,4 36,5 36,4 94,9Brasil/ Brazil 21,2 13,5 15,0 51,1 24,0 21,9 32,9 56,0 102,0 93,1España/ Spain 93,1 57,4 23,8 24,0 46,7 32,4 44,4 38,2 48,3 85,9Suecia / Swe<strong>de</strong>n 13,3 12,2 70,7 91,9 77,2 81,9 99,8 86,7 65,9 70,0Finlandia / Finland 30,8 16,7 19,9 37,3 34,3 27,7 40,2 55,2 33,0 67,9Singapur / Singapore 136,9 77,3 60,8 59,1 37,8 39,3 34,4 94,2 68,7 42,1Estados Unidos / USA 25,6 96,9 23,3 29,2 123,2 127,1 51,1 123,6 51,7 38,3México / Mexico 100,1 76,2 129,3 55,2 20,6 23,5 37,0 62,0 57,0 33,1Sudáfrica / South Africa 45,8 27,0 36,6 17,9 16,9 10,2 19,7 24,7 17,6 12,2SUBTOTAL 6.603,2 6.570,9 7.098,2 6.894,7 6.860,9 6.834,9 7.231,3 7.277,4 7.361,8 7.301,6OTROS / Other 167,8 185,6 214,3 210,1 173,2 194,3 223,0 199,3 256,6 155,8TOTAL 6.771,0 6.756,5 7.312,5 7.104,8 7.034,1 7.029,2 7.454,3 7.476,6 7.618,5 7.457,5B. BLÍSTER / BlisterChile 168,2 174,6 154,9 182,3 275,9 366,1 347,3 457,1 505,5 407,7Bulgaria 75,4 147,5 119,1 128,9 173,0 170,0 177,4 168,5 139,3 146,3Canadá /Canada 79,8 53,8 80,1 84,1 84,2 76,0 87,1 88,3 95,9 85,2España / Spain 25,5 27,1 35,1 21,1 37,4 50,9 62,3 45,9 37,2 41,7Finlandia / Finland 32,3 41,6 51,8 43,2 33,2 25,3 29,7 35,0 10,5 26,9Estados Unidos / USA 32,5 24,7 27,0 34,5 35,3 46,5 41,7 18,9 15,7 23,5México / Mexico 31,0 21,8 23,8 18,2 15,9 21,3 17,8 19,8 24,0 13,7Japón /Japan 38,5 42,8 45,1 50,4 10,3 8,1 11,8 9,3 9,8 12,5Bélgica / Belgium 12,0 17,7 12,3 3,5 10,5 19,9 4,5 8,8 10,8 10,7Perú / Peru 30,7 23,6 31,2 24,7 21,7 - - 16,1 25,1 10,0China 3,5 2,4 2,4 3,4 1,5 1,3 3,7 2,8 0,0 6,1Sudáfrica / South Africa - 0,9 34,6 25,6 12,5 1,0 5,6 6,9 8,2 3,8Kazakhstan / Kazakhstan - 6,2 9,4 7,3 5,7 10,0 7,1 2,5 - -Rusia / Russia 6,2 3,7 - - - - - - - -SUBTOTAL 535,6 588,3 626,8 627,3 716,9 796,4 795,9 879,8 881,9 788,3Otros / Other 20,3 32,4 82,5 57,6 53,7 73,1 45,4 54,9 42,4 73,3TOTAL 555,9 620,7 709,3 684,9 770,7 869,5 841,4 934,7 924,4 861,6C. GRANELES / BulkChile 1.546,7 1.749,2 1.798,2 1.552,7 1.797,5 2.165,6 2.190,4 2.171,1 2.258,1 2.014,4Perú / Peru 48,2 80,2 92,8 370,8 280,4 501,7 522,8 462,4 735,8 776,1Australia 259,2 255,4 312,1 289,7 338,9 296,0 402,0 394,1 381,1 451,8Indonesia 485,0 644,0 649,3 718,9 595,4 451,9 595,7 582,7 431,6 406,7Canadá / Canada 263,8 480,2 622,1 283,0 169,8 165,1 255,9 230,7 215,4 349,6Estados Unidos / USA 75,7 174,6 45,3 23,3 10,1 24,2 136,7 382,9 302,5 303,4Sudáfrica / South Africa 10,8 0,6 7,6 4,4 5,7 9,8 12,1 30,3 59,2 262,8Papúa Nueva Guinea / Papua New Guinea 183,8 186,3 188,6 176,8 221,6 163,1 203,7 174,4 186,5 162,7Brasil/ Brazil 0,2 - - - - 57,3 97,0 91,0 143,3 159,5Argentina 179,7 123,3 163,4 181,1 169,7 173,2 172,6 167,9 171,4 157,1Mongolia 123,2 123,2 116,7 135,2 140,8 140,7 146,2 149,8 151,9 145,7Portugal 110,3 81,4 92,0 49,2 71,7 86,6 93,8 82,1 99,9 93,9México / Mexico 18,4 77,2 25,0 34,4 35,3 59,9 33,0 27,9 41,9 49,8Bulgaria 33,6 24,4 24,0 20,8 18,2 19,6 31,2 48,3 42,0 26,5Filipinas / Philippines 36,6 20,8 14,5 11,5 9,1 6,8 13,8 15,4 25,6 26,2Rusia / Russia 6,5 6,3 2,7 3,0 0,9 17,8 24,2 - 2,6 4,6Kazakhstan / Kazakhstan 2,6 30,4 16,5 40,1 54,8 65,0 31,5 20,5 54,9 -España /Spain 20,8 7,3 19,9 1,7 0,7 1,1 3,6 1,5 0,2 0,1Suecia / Swe<strong>de</strong>n 7,4 7,2 3,7 - 0,0 0,0 - 1,2 - 0,0SUBTOTAL 3.412,4 4.071,8 4.194,4 3.896,5 3.920,5 4.405,4 4.966,2 5.034,3 5.304,0 5.391,0OTROS / Other 117,0 73,7 95,4 102,7 117,0 79,7 99,7 84,5 192,6 114,0TOTAL 3.529,4 4.145,6 4.289,9 3.999,2 4.037,4 4.485,1 5.065,8 5.118,8 5.496,6 5.505,0(1) Enero a septiembre. / (1) January-September.(p) Cifras provisionales para 2008. / (p) Estimated.Fuente / Source: World Metal Statistics April 2009 and Yearbook 2008.- Comisión Chilena <strong>de</strong>l Cobre: Cifras <strong>de</strong> exportación <strong>de</strong> Chile / Chile data: Chilean Copper Commission.COCHILCO157


