anuario de estadÃsticas del cobre y otros minerales - Comisión ...
anuario de estadÃsticas del cobre y otros minerales - Comisión ...
anuario de estadÃsticas del cobre y otros minerales - Comisión ...
- No tags were found...
You also want an ePaper? Increase the reach of your titles
YUMPU automatically turns print PDFs into web optimized ePapers that Google loves.
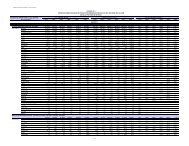
TABLA / TABLE 23.2VALORES DE LOS EMBARQUES DE EXPORTACIÓN DE OTROS SUBPRODUCTOS DEL COBRE POR PAÍS DE DESTINO (1)Exports of Other Copper Byproducts, by Destination(FOB líquido <strong>de</strong> retorno en millones <strong>de</strong> dólares) / (US$ Mn FOB)1999 2000 2001 2002 2003 2004 2005 2006 2007 2008EUROPA / Europe 134,6 168,7 134,2 145,1 186,9 403,7 707,7 769,6 845,2 1.131,3Alemania / Germany 14,6 17,7 1,8 0,3 0,6 11,2 30,6 22,2 4,2 16,0Alemania R.D. / GDR - - - - - - - - - -Austria 7,3 9,8 2,7 2,5 2,3 - 4,5 0,1 - 1,0Bélgica / Belgium 33,1 40,1 46,9 12,5 38,0 24,5 46,4 61,4 46,9 46,7España / Spain 9,0 8,4 8,8 13,9 9,2 11,7 52,0 52,0 50,2 66,5Finlandia / Finland 1,6 0,8 0,4 4,1 1,1 - 13,7 4,2 - 4,4Francia / France - - 0,1 - 0,4 0,2 3,3 - - 9,7Holanda / Netherlands 37,8 35,0 44,6 47,2 80,4 257,3 328,9 370,2 489,2 719,5Italia / Italy 7,5 6,0 6,7 8,4 9,4 21,1 84,1 69,1 61,1 65,8Noruega / Norway - - - - - 0,2 - - - -Portugal - - - - - - 0,9 - - -Reino Unido / United Kingdom 9,8 10,9 8,7 33,2 25,8 33,1 48,0 70,6 59,9 71,5Rusia / Russia - - 0,6 0,2 0,1 - - - - -Suecia / Swe<strong>de</strong>n 13,9 39,9 10,5 22,8 19,6 44,4 95,3 117,2 133,1 111,0Suiza / Switzerland - - 2,2 - - - - 0,5 0,6 16,6OTROS / Other - 0,1 0,2 - - - - 2,1 0,0 2,7AMÉRICA / America 110,6 102,4 125,2 141,7 156,1 269,7 474,8 421,9 473,8 627,1Argentina 5,3 6,4 4,7 6,3 8,0 24,0 13,3 19,4 5,3 18,4Bolivia - (a) (a) 0,2 0,5 0,8 1,0 0,9 0,9 2,6Brasil / Brazil 13,6 19,6 17,0 29,1 34,3 90,6 184,4 152,7 192,5 238,5Canadá / Canada 5,8 1,4 - - - - 9,4 11,4 12,8 13,5Colombia - - - - - - - - - -Estados Unidos / USA 73,4 73,0 79,3 82,9 92,9 129,5 202,9 175,7 171,7 268,7Honduras - 0,2 - - - - - - - -México / Mexico 12,2 1,5 23,9 22,6 18,8 23,5 49,9 61,0 88,9 84,7Panamá / Panama - - - - - - 1,7 - - -Perú / Peru 0,1 0,2 0,1 0,5 1,6 1,3 4,2 - - 0,7Venezuela - - - - - - - - - -OTROS / Other 0,2 0,1 0,2 0,1 - - 8,0 0,8 1,7 -ASIA 61,4 65,8 52,8 73,5 97,4 414,6 982,6 718,5 904,0 889,5Corea <strong>de</strong>l Norte / North Korea - - - - 0,6 - - - - -Corea <strong>de</strong>l Sur / South Korea 9,1 8,3 2,4 4,8 9,1 59,5 166,8 86,2 91,1 66,2China 0,7 1,8 5,0 1,0 - 1,1 0,1 5,9 1,2 3,9Emiratos Árabes / Arab Emirates - - - - - - - - - -Hong Kong - - 0,1 - - 1,8 0,7 0,4 - -India 0,2 0,6 1,1 1,8 0,4 1,8 0,6 2,1 12,7 17,2Indonesia - - - - - - - - - -Irán / Iran - - - - - - 0,1 - - -Japón / Japan 50,5 53,0 42,2 62,5 82,1 349,9 812,8 623,3 799,0 799,6Singapur / Singapore - 0,1 0,1 0,2 - - - 0,6 - 0,9Tailandia / Thailand - - - - - - - - - -Taiwán / Taiwan 0,9 2,0 1,9 3,2 5,2 0,5 1,5 - - -OTROS / Other - - - - - - - - - 1,8OTROS / Other 4,4 4,9 3,7 8,7 15,0 14,8 19,3 17,2 44,8 38,4Sudáfrica / South Africa 3,7 4,6 3,6 8,4 15,0 14,8 18,8 17,2 44,5 37,5Australia 0,7 0,2 0,1 0,3 - - - - 0,3 0,9Nueva Zelandia / New Zealand - - - - - - - - - -OTROS / Other - 0,1 - - - - 0,5 - - -TOTAL 311,0 341,8 315,9 369,0 455,4 1.102,8 2.184,4 1.927,2 2.267,8 2.686,2(1) Incluye barros anódicos, metal doré, plata, selenio, óxido <strong>de</strong> molib<strong>de</strong>no y <strong>otros</strong>. / Inclu<strong>de</strong>s anodic slimes, doré, silver, selenium, molyb<strong>de</strong>num oxi<strong>de</strong> and others.(a) Valor inferior a 50 mil dólares / Un<strong>de</strong>r US$50,000.Fuente / Source: Comisión Chilena <strong>de</strong>l Cobre / Chilean Copper Commission.COCHILCO59


