

anuario de estadÃsticas del cobre y otros minerales - Comisión ...
anuario de estadÃsticas del cobre y otros minerales - Comisión ...
anuario de estadÃsticas del cobre y otros minerales - Comisión ...
- No tags were found...

Create successful ePaper yourself
Turn your PDF publications into a flip-book with our unique Google optimized e-Paper software.
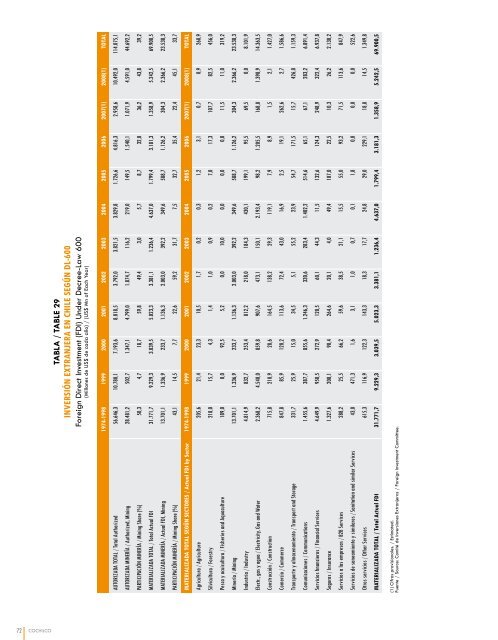
TABLA / TABLE 29INVERSIÓN EXTRANJERA EN CHILE SEGÚN DL-600Foreign Direct Investment (FDI) Un<strong>de</strong>r Decree-Law 600(Millones <strong>de</strong> US$ <strong>de</strong> cada año) / (US$ Mn of Each Year)1974-1998 1999 2000 2001 2002 2003 2004 2005 2006 2007(1) 2008(1) TOTALAUTORIZADA TOTAL / Total Authorized 56.646,3 10.780,1 7.193,6 8.018,5 3.792,0 3.821,5 3.829,8 1.726,6 4.816,3 2.958,6 10.492,0 114.075,1AUTORIZADA MINERÍA / Authorized, Mining 28.481,2 502,7 1.347,1 4.799,0 1.874,7 116,2 219,0 149,5 1.540,1 1.071,9 4.591,0 44.692,2PARTICIPACIÓN MINERÍA / Mining Share (%) 50,3 4,7 18,7 59,8 49,4 3,0 5,7 8,7 32,0 36,2 43,8 39,2MATERIALIZADA TOTAL / Total Actual FDI 31.771,7 9.229,3 3.039,5 5.023,3 3.381,1 1.236,4 4.637,0 1.799,4 3.181,3 1.358,9 5.242,5 69.900,5MATERIALIZADA MINERÍA / Actual FDI, Mining 13.701,1 1.336,9 233,7 1.136,3 2.003,0 392,2 349,6 588,7 1.126,2 304,3 2.366,2 23.538,3PARTICIPACIÓN MINERÍA / Mining Share (%) 43,1 14,5 7,7 22,6 59,2 31,7 7,5 32,7 35,4 22,4 45,1 33,7MATERIALIZADA TOTAL SEGÚN SECTORES / Actual FDI by Sector 1974-1998 1999 2000 2001 2002 2003 2004 2005 2006 2007(1) 2008(1) TOTALAgricultura / Agriculture 205,6 21,4 23,3 10,5 1,7 0,2 0,3 1,2 3,1 0,7 0,9 268,9Silvicultura / Forestry 218,0 15,7 4,3 1,4 1,0 0,9 0,2 7,0 17,3 107,7 82,5 456,0Pesca y acuicultura / Fisheries and Aquaculture 189,0 0,0 92,5 5,2 0,0 10,0 0,0 0,0 0,0 11,5 11,0 319,2Minería / Mining 13.701,1 1.336,9 233,7 1.136,3 2.003,0 392,2 349,6 588,7 1.126,2 304,3 2.366,2 23.538,3Industria / Industry 4.814,9 832,7 253,4 812,2 218,0 184,3 430,1 199,1 95,5 69,5 0,0 8.101,9Electr., gas y agua / Electricity, Gas and Water 2.368,2 4.540,0 859,8 907,6 473,1 150,1 2.193,4 98,2 1.205,5 168,8 1.398,9 14.363,5Construcción / Construction 715,8 210,9 28,6 164,5 138,2 29,3 119,1 7,9 8,9 1,5 2,1 1.427,0Comercio / Commerce 847,8 85,9 120,2 113,6 72,4 43,0 16,9 2,5 19,1 262,6 2,7 1.586,6Transporte y almacenamiento / Transport and Storage 331,7 25,9 15,0 34,5 5,1 55,2 23,9 54,7 171,5 15,7 426,0 1.159,3Comunicaciones / Communications 1.455,6 387,7 855,6 1.246,3 330,6 283,4 1.402,2 514,6 65,1 67,1 283,2 6.891,4Servicios financieros / Financial Services 4.649,9 950,5 272,9 120,5 60,1 44,3 11,5 132,6 124,3 248,9 322,4 6.937,8Seguros / Insurance 1.327,6 208,1 90,4 264,6 20,1 4,0 49,4 107,0 22,5 10,3 26,2 2.130,2Servicios a las empresas / B2B Services 288,2 25,5 66,2 59,6 38,5 21,1 15,5 55,0 93,2 71,5 113,6 847,9Servicios <strong>de</strong> saneamiento y similares / Sanitation and similar Services 43,0 471,3 1,6 3,1 1,0 0,7 0,1 1,8 0,0 0,0 0,0 522,6Otros servicios / Other Services 615,3 116,9 122,3 143,3 18,3 17,7 24,8 29,0 229,1 18,8 14,5 1.349,8MATERIALIZADA TOTAL / Total Actual FDI 31.771,7 9.229,3 3.039,5 5.023,3 3.381,1 1.236,4 4.637,0 1.799,4 3.181,3 1.358,9 5.242,5 69.900,5(1) Cifras provisionales. / Estimated.Fuente / Source: Comité <strong>de</strong> Inversiones Extranjeras / Foreign Investment Committee.72 COCHILCO


