anuario de estadÃsticas del cobre y otros minerales - Comisión ...
anuario de estadÃsticas del cobre y otros minerales - Comisión ...
anuario de estadÃsticas del cobre y otros minerales - Comisión ...
- No tags were found...
You also want an ePaper? Increase the reach of your titles
YUMPU automatically turns print PDFs into web optimized ePapers that Google loves.
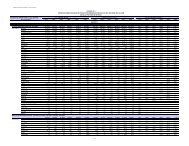
TABLA / TABLE 70VENTAS DE COBRE REFINADO A LA INDUSTRIA MANUFACTURERA NACIONALRefined Copper Sales to Domestic Manufacturing Industry(Miles <strong>de</strong> T.M <strong>de</strong> <strong>cobre</strong> fino) / (kMT Copper Content)1999 2000 2001 2002 2003 2004 2005 2006 2007 2008Cátodos / Catho<strong>de</strong>s 65,0 69,3 78,1 66,5 76,4 82,1 85,7 94,0 95,1 94,8RAF / Fire Refined 10,2 13,7 11,9 15,0 18,3 18,3 17,0 16,7 10,2 8,4TOTAL 75,2 83,0 90,0 81,5 94,7 100,4 102,7 110,7 105,3 103,2Fuente / Source: Comisión Chilena <strong>de</strong>l Cobre / Chilean Copper Commission.TABLA / TABLE 71VALORES DE IMPORTACIONES CHILENAS DE PRODUCTOS MINEROS METÁLICOS Y NO METÁLICOSMining Product Imports, Including Metals and Industrial Minerals(Millones <strong>de</strong> US$ CIF <strong>de</strong> cada año) / (Millions of Current US$ CIF)1999 2000 2001 2002 2003 2004 2005 2006 2007 2008MINERÍA METÁLICA / Metal Mining 23,6 22,7 27,1 39,7 90,5 310,4 802,2 775,3 1.040,8 1.051,6Mineral <strong>de</strong> <strong>cobre</strong> / Copper Ores - - 3,4 6,8 8,8 43,4 79,1 222,1 174,7 200,2Mineral <strong>de</strong> aluminio / Aluminum Ores 0,4 1,5 1,9 1,7 1,4 2,8 2,9 1,6 3,8 1,1Mineral <strong>de</strong> cromo / Chromium Ores 1,0 2,4 2,2 1,4 2,9 2,0 3,8 2,7 3,4 5,2Concentrados <strong>de</strong> molib<strong>de</strong>no / Molyb<strong>de</strong>num Concentrates 22,2 18,8 19,6 29,8 77,4 262,2 716,4 548,9 858,9 845,1MINERÍA NO METÁLICA / Industrial Minerals 23,6 29,9 29,2 34,4 34,7 41,6 42,8 49,2 58,1 86,3Azufre / Sulfur 0,8 0,6 0,9 0,9 1,9 3,1 2,5 1,4 1,2 3,8Caolín / Kaolin 3,5 4,1 4,0 5,1 5,4 5,5 4,1 3,8 3,7 4,1Bentonita / Bentonite 1,2 1,3 1,5 1,1 1,0 1,1 1,1 1,7 3,0 4,9Creta / Chalk - 1,3 1,1 0,9 1,7 1,8 2,0 2,4 3,1 2,8Diatomita / Diatomite - 1,1 0,8 1,0 0,8 0,8 0,9 1,1 2,0 1,6Dolomita / Dolomite 3,3 3,4 2,7 2,8 2,6 4,6 4,8 5,5 7,1 8,6Magnesita calcinada / Calcined Magnesite 2,4 2,1 3,5 6,7 5,4 7,2 3,1 4,5 8,5 13,6Talco / Talc 2,4 2,8 2,4 2,4 2,5 2,9 3,1 3,3 3,9 4,8Borato natural / Borate - 0,6 . 2,0 1,2 1,4 0,3 0,1 (a) 0,1Abono origen animal o vegetal / Guano - 1,3 1,3 1,1 1,5 1,6 2,8 2,9 3,1 4,2Arena natural / Sand - 2,2 1,3 1,1 1,3 1,5 1,3 2,0 3,0 4,3Fosfato <strong>de</strong> calcio / Calcium Phosphate 6,1 6,0 7,9 7,9 7,3 8,2 11,4 16,5 17,8 31,2Óxido <strong>de</strong> magnesio / Magnesium Oxi<strong>de</strong> 1,0 0,5 0,8 0,5 1,2 0,7 4,6 2,6 1,0 2,0Asbesto / Asbestos 1,0 1,0 0,2 0,0 0,0 0,0 0,0 0,0 0,0 0,0Materias <strong>minerales</strong> no expresadas / Other Industrial Minerals 1,9 1,6 0,8 0,9 0,9 1,2 0,8 1,4 0,7 0,5OTROS / Other 8,9 7,7 7,7 8,6 12,1 28,6 29,2 58,3 162,2 203,2TOTAL IMPORTACIONES MINERAS / Total Imports 56,1 60,3 64,0 82,7 137,3 380,6 874,2 882,8 1.261,0 1.341,1Fuente / Source: Banco Central / Central Bank.PARTICIPACIÓN DEL SECTOR MINERO EN LAS IMPORTACIONES DEL PAÍSMining Sector Share of Total Imports(%)1999 2000 2001 2002 2003 2004 2005 2006 2007 2008TOTAL MINERÍA / Total Mining 0,4 0,3 0,4 0,5 0,7 1,5 2,7 2,3 2,7 2,2126 COCHILCO


