anuario de estadÃsticas del cobre y otros minerales - Comisión ...
anuario de estadÃsticas del cobre y otros minerales - Comisión ...
anuario de estadÃsticas del cobre y otros minerales - Comisión ...
- No tags were found...
You also want an ePaper? Increase the reach of your titles
YUMPU automatically turns print PDFs into web optimized ePapers that Google loves.
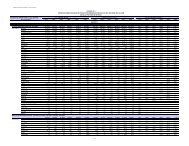
TABLA / TABLE 38CONSUMO APARENTE, PRODUCCIÓN, IMPORTACIONES Y EXPORTACIONES DE ÁCIDO SULFÚRICO EN CHILESULFURIC ACID: APPARENT CONSUMPTION, PRODUCTION, IMPORT AND EXPORT(Miles <strong>de</strong> TM) / (kMT)1999 2000 2001 2002 2003 2004 2005 2006 2007 2008CONSUMO APARENTE / APPARENT CONSUMPTION (1) 3.544,1 3.797,3 4.215,8 4.286,8 4.805,1 4.804,7 5.080,5 5.502,6 5.966,9 7.132,2PRODUCCIÓN TOTAL / TOTAL PRODUCTION 3.296,0 3.352,0 3.659,2 3.838,0 4.479,6 4.614,8 5.009,0 5.027,0 4.806,0 4.817,6EMBARQUES DE IMPORTACIÓN / IMPORTS 380,7 528,5 558,5 522,5 487,8 340,2 552,4 606,9 1.285,1 2.398,5EMBARQUES DE EXPORTACIÓN / EXPORTS 132,6 83,2 1,9 73,7 162,3 150,3 480,9 131,3 124,2 83,9(1) Consumo aparente= Producción + Importaciones - Exportaciones / Apparent Consumption= Production + Imports - ExportsFuente / Source: Comisión Chilena <strong>de</strong>l Cobre, cifras <strong>de</strong> producción / Production Reports, Chilean Copper CommissionServicio Nacional <strong>de</strong> Aduanas <strong>de</strong> Chile, cifras <strong>de</strong> comercio exterior / Chilean Customs Service, Foreign Tra<strong>de</strong> ReportsFuente / Source: Comisión Chilena <strong>de</strong>l Cobre / Chilean Copper CommissionTABLA / TABLE 39PRODUCCIÓN CHILENA DE ÁCIDO SULFÚRICO POR REGIONESCHILEAN SULFURIC ACID PRODUCTION, BY REGION(Miles <strong>de</strong> TM) / (kMT)1999 2000 2001 2002 2003 2004 2005 2006 2007 2008Primera Región / Region I 125,0 0,0 0,0 89,0 118,0 124,0 117,0 120,0 115,0 104,0Segunda Región / Region II 1.679,0 1.556,0 1.523,7 1.555,7 1.811,9 1.951,5 2.225,0 2.140,0 2.093,0 1.978,0Tercera Región / Region III 299,0 603,0 596,9 510,5 690,0 784,4 798,0 805,0 740,0 729,0SUB-TOTAL ZONA NORTE / SUBTOTAL, NORTHERN CHILE 2.103,0 2.159,0 2.120,6 2.155,2 2.619,9 2.859,9 3.140,0 3.065,0 2.948,0 2.811,0Quinta Región / Region V 752,0 751,0 725,3 807,6 808,2 785,7 719,0 846,0 829,0 821,6Región Metropolitana / Metropolitan Region 20,0 31,0 40,0 43,0 41,0 42,0 44,0 39,0 49,0 70,0Sexta Región / Region VI 421,0 411,0 773,3 832,2 1.010,5 928,2 1.105,0 1.076,0 980,0 1.115,0SUB-TOTAL ZONA CENTRAL / SUBTOTAL, CENTRAL CHILE 1.193,0 1.193,0 1.538,6 1.682,8 1.859,7 1.754,9 1.869,0 1.962,0 1.858,0 2.006,6TOTAL PAÍS / COUNTRY TOTAL 3.296,0 3.352,0 3.659,2 3.838,0 4.479,6 4.614,8 5.009,0 5.027,0 4.806,0 4.817,682 COCHILCO


