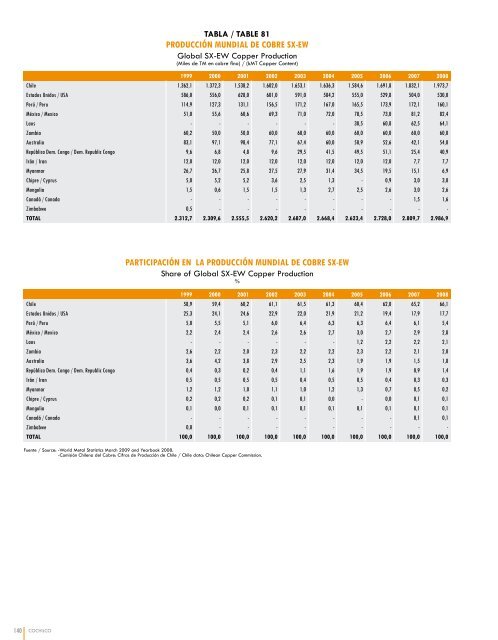
TABLA / TABLE 81PRODUCCIÓN MUNDIAL DE COBRE SX-EWGlobal SX-EW Copper Production(Miles <strong>de</strong> TM en <strong>cobre</strong> fino) / (kMT Copper Content)1999 2000 2001 2002 2003 2004 2005 2006 2007 2008Chile 1.362,1 1.372,3 1.538,2 1.602,0 1.653,1 1.636,3 1.584,6 1.691,8 1.832,1 1.973,7Estados Unidos / USA 586,0 556,0 628,0 601,0 591,0 584,2 555,0 529,8 504,0 530,0Perú / Peru 114,9 127,3 131,1 156,5 171,2 167,0 165,5 173,9 172,1 160,1México / Mexico 51,0 55,6 60,6 69,3 71,0 72,0 78,5 73,0 81,2 82,4Laos - - - - - - 30,5 60,8 62,5 64,1Zambia 60,2 50,0 50,0 60,0 60,0 60,0 60,0 60,0 60,0 60,0Australia 83,1 97,1 98,4 77,1 67,4 60,0 50,9 52,6 42,1 54,0República Dem. Congo / Dem. Republic Congo 9,6 6,8 4,8 9,6 29,5 41,5 49,5 51,1 25,4 40,9Irán / Iran 12,0 12,0 12,0 12,0 12,0 12,0 12,0 12,0 7,7 7,7Myanmar 26,7 26,7 25,8 27,5 27,9 31,4 34,5 19,5 15,1 6,9Chipre / Cyprus 5,0 5,2 5,2 3,6 2,5 1,3 - 0,9 3,0 3,0Mongolia 1,5 0,6 1,5 1,5 1,3 2,7 2,5 2,6 3,0 2,6Canadá / Canada - - - - - - - - 1,5 1,6Zimbabwe 0,5 - - - - - - - - -TOTAL 2.312,7 2.309,6 2.555,5 2.620,2 2.687,0 2.668,4 2.623,4 2.728,0 2.809,7 2.986,9PARTICIPACIÓN EN LA PRODUCCIÓN MUNDIAL DE COBRE SX-EWShare of Global SX-EW Copper Production%1999 2000 2001 2002 2003 2004 2005 2006 2007 2008Chile 58,9 59,4 60,2 61,1 61,5 61,3 60,4 62,0 65,2 66,1Estados Unidos / USA 25,3 24,1 24,6 22,9 22,0 21,9 21,2 19,4 17,9 17,7Perú / Peru 5,0 5,5 5,1 6,0 6,4 6,3 6,3 6,4 6,1 5,4México / Mexico 2,2 2,4 2,4 2,6 2,6 2,7 3,0 2,7 2,9 2,8Laos - - - - - - 1,2 2,2 2,2 2,1Zambia 2,6 2,2 2,0 2,3 2,2 2,2 2,3 2,2 2,1 2,0Australia 3,6 4,2 3,8 2,9 2,5 2,3 1,9 1,9 1,5 1,8República Dem. Congo / Dem. Republic Congo 0,4 0,3 0,2 0,4 1,1 1,6 1,9 1,9 0,9 1,4Irán / Iran 0,5 0,5 0,5 0,5 0,4 0,5 0,5 0,4 0,3 0,3Myanmar 1,2 1,2 1,0 1,1 1,0 1,2 1,3 0,7 0,5 0,2Chipre / Cyprus 0,2 0,2 0,2 0,1 0,1 0,0 - 0,0 0,1 0,1Mongolia 0,1 0,0 0,1 0,1 0,1 0,1 0,1 0,1 0,1 0,1Canadá / Canada - - - - - - - - 0,1 0,1Zimbabwe 0,0 - - - - - - - - -TOTAL 100,0 100,0 100,0 100,0 100,0 100,0 100,0 100,0 100,0 100,0Fuente / Source: -World Metal Statistics March 2009 and Yearbook 2008.-Comisión Chilena <strong>de</strong>l Cobre: Cifras <strong>de</strong> Producción <strong>de</strong> Chile / Chile data: Chilean Copper Commission.140 COCHILCO
TABLA / TABLE 82PRODUCCIÓN MUNDIAL DE ORO DE MINAGlobal Gold Mine Production(TM <strong>de</strong> oro fino) / (MT Gold Content)1999 2000 2001 2002 2003 2004 2005 2006 2007 2008Estados Unidos / USA 341,0 337,7 335,0 298,0 277,0 258,0 256,0 252,0 239,0 229,7China 169,1 175,0 181,8 179,6 194,4 194,4 208,8 240,1 270,5 221,5Sudáfrica / South Africa 447,2 428,5 393,5 395,2 373,3 340,4 297,3 275,1 254,7 220,1Australia 300,4 296,4 280,1 266,1 282,0 259,0 263,0 247,0 245,0 215,0Perú / Peru 128,5 132,6 134,0 157,3 173,0 173,2 207,8 203,3 170,1 179,9Rusia / Russia 125,9 143,9 155,0 171,0 176,9 174,1 163,2 159,3 156,9 157,2Canadá / Canada 157,8 155,5 160,2 152,1 141,5 130,7 120,5 104,4 102,4 96,4Ghana / Ghana 81,1 72,0 68,6 65,8 70,8 63,2 66,7 69,8 76,5 79,5Uzbekistán / Uzbekistan 88,1 87,5 85,4 87,8 86,0 86,0 84,2 76,6 72,9 73,2Papúa Nueva Guinea / Papua New Guinea 65,8 73,3 67,0 63,2 68,1 73,5 68,7 53,7 55,9 66,6Indonesia 129,0 117,6 166,1 142,2 164,4 164,4 138,7 79,6 105,0 63,2México / Mexico 23,8 24,5 23,5 21,3 20,2 21,3 30,4 39,0 43,7 49,7Brasil / Brazil 50,4 60,8 51,6 41,7 40,4 47,6 38,3 43,1 49,6 49,2Mali - - - - - - 43,8 50,0 40,0 40,7Chile 48,0 54,1 42,7 38,7 39,0 40,0 40,4 42,1 41,5 39,2Argentina 38,5 26,0 30,6 32,5 29,7 28,5 27,9 44,1 42,0 37,6Filipinas / Philippines 31,1 36,5 33,8 35,8 39,0 35,5 37,5 36,1 38,8 37,1Tanzania 4,8 15,1 33,8 42,3 48,0 51,0 47,7 40,7 40,2 36,6Kazajstán / Kazakhstan 22,5 16,4 16,8 16,8 16,8 16,8 17,9 21,4 21,4 20,9Fiji 5,1 3,8 3,9 3,8 3,5 4,0 2,8 1,4 0,0 19,3Colombia 34,6 37,0 21,8 20,8 46,5 37,7 35,8 15,7 15,5 19,2Guinea / Guinea 11,7 15,7 16,3 16,7 16,3 15,2 13,9 11,0 12,6 18,5Kirguistán / Kyrgyzstan 19,0 20,8 24,4 19,2 21,1 20,4 15,6 9,4 9,4 17,3Mongolia 11,0 11,8 13,7 12,1 11,1 17,5 24,1 22,6 17,4 15,2Nueva Zelandia / New Zealand 8,9 9,9 9,9 9,8 9,3 10,2 10,6 10,6 10,8 13,3Surinam - - - - - - 10,6 10,4 8,6 10,3Bolivia 11,8 12,0 12,4 11,3 9,4 6,2 8,9 9,6 8,8 8,5OTROS / Other 101,1 96,8 101,5 107,8 103,5 124,2 153,0 147,7 131,3 129,9TOTAL 2.456,2 2.461,2 2.463,3 2.408,8 2.461,2 2.393,0 2.434,0 2.316,1 2.280,6 2.164,6PARTICIPACIÓN EN LA PRODUCCIÓN MUNDIALShare of Global Production(%)1999 2000 2001 2002 2003 2004 2005 2006 2007 2008Estados Unidos / USA 13,9 13,7 13,6 12,4 11,3 10,8 10,5 10,9 10,5 10,6China 6,9 7,1 7,4 7,5 7,9 8,1 8,6 10,4 11,9 10,2Sudáfrica / South Africa 18,2 17,4 16,0 16,4 15,2 14,2 12,2 11,9 11,2 10,2Australia 12,2 12,0 11,4 11,0 11,5 10,8 10,8 10,7 10,7 9,9Perú / Peru 5,2 5,4 5,4 6,5 7,0 7,2 8,5 8,8 7,5 8,3Rusia / Russia 5,1 5,8 6,3 7,1 7,2 7,3 6,7 6,9 6,9 7,3Canadá / Canada 6,4 6,3 6,5 6,3 5,8 5,5 5,0 4,5 4,5 4,5Ghana / Ghana 3,3 2,9 2,8 2,7 2,9 2,6 2,7 3,0 3,4 3,7Uzbekistán / Uzbekistan 3,6 3,6 3,5 3,6 3,5 3,6 3,5 3,3 3,2 3,4Papúa Nueva Guinea / Papua New Guinea 2,7 3,0 2,7 2,6 2,8 3,1 2,8 2,3 2,5 3,1Indonesia 5,3 4,8 6,7 5,9 6,7 6,9 5,7 3,4 4,6 2,9México / Mexico 1,0 1,0 1,0 0,9 0,8 0,9 1,2 1,7 1,9 2,3Brasil / Brazil 2,1 2,5 2,1 1,7 1,6 2,0 1,6 1,9 2,2 2,3Mali - - - - - - 1,8 2,2 1,8 1,9Chile 2,0 2,2 1,7 1,6 1,6 1,7 1,7 1,8 1,8 1,8Argentina 1,6 1,1 1,2 1,3 1,2 1,2 1,1 1,9 1,8 1,7Filipinas / Philippines 1,3 1,5 1,4 1,5 1,6 1,5 1,5 1,6 1,7 1,7Tanzania 0,2 0,6 1,4 1,8 2,0 2,1 2,0 1,8 1,8 1,7Kazajstán / Kazakhstan 0,9 0,7 0,7 0,7 0,7 0,7 0,7 0,9 0,9 1,0Fiji 0,2 0,2 0,2 0,2 0,1 0,2 0,1 0,1 0,0 0,9Colombia 1,4 1,5 0,9 0,9 1,9 1,6 1,5 0,7 0,7 0,9Guinea / Guinea 0,5 0,6 0,7 0,7 0,7 0,6 0,6 0,5 0,6 0,9Kirguistán / Kyrgyzstan 0,8 0,8 1,0 0,8 0,9 0,9 0,6 0,4 0,4 0,8Mongolia 0,4 0,5 0,6 0,5 0,5 0,7 1,0 1,0 0,8 0,7Nueva Zelandia / New Zealand 0,4 0,4 0,4 0,4 0,4 0,4 0,4 0,5 0,5 0,6Surinam - - - - - - 0,4 0,5 0,4 0,5Bolivia 0,5 0,5 0,5 0,5 0,4 0,3 0,4 0,4 0,4 0,4OTROS / Other 4,1 3,9 4,1 4,5 4,2 5,2 6,3 6,4 5,8 6,0TOTAL 100,0 100,0 100,0 100,0 100,0 100,0 100,0 100,0 100,0 100,0Fuente / Source: -World Metal Statistics March 2009 and Yearbook 2008.-Comisión Chilena <strong>de</strong>l Cobre: Cifras <strong>de</strong> Producción <strong>de</strong> Chile / Chile data: Chilean Copper Commission.COCHILCO141