anuario de estadÃsticas del cobre y otros minerales - Comisión ...
anuario de estadÃsticas del cobre y otros minerales - Comisión ...
anuario de estadÃsticas del cobre y otros minerales - Comisión ...
- No tags were found...
You also want an ePaper? Increase the reach of your titles
YUMPU automatically turns print PDFs into web optimized ePapers that Google loves.
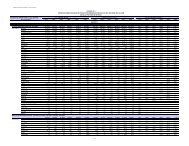
Fuente / Source: Instituto Nacional <strong>de</strong> Estadísticas / National Statistics Institute.TABLA / TABLE 3.1ÍNDICE DE PRODUCCIÓN MINERAMining Sector Production(Base: Promedio 2003 = 100) / (Baseline: 2003 Average = 100)1989 1990 1991 1992 1993 1994 1995 1996 1997 1998MINERÍA METÁLICA / Metals 34,9 35,2 39,9 42,8 44,8 48,3 54,2 67,0 73,7 78,5MINERÍA NO METÁLICA / Industrial Minerals 91,2 90,5 89,1 84,0 81,8 76,0 75,7 77,0 87,9 81,3ÍNDICE GENERAL / General In<strong>de</strong>x 37,4 37,7 42,2 44,7 46,5 49,6 55,2 67,5 74,4 78,6TABLA / TABLE 4.1PRODUCCIÓN CHILENA DE MOLIBDENO COMERCIABLE POR EMPRESA (1)Molyb<strong>de</strong>num Production by Company(Toneladas métricas <strong>de</strong> molib<strong>de</strong>no fino) / (MT Molyb<strong>de</strong>num Content)1989 1990 1991 1992 1993 1994 1995 1996 1997 1998DIV. CODELCO NORTECONCENTRADO / Concentrate 2.206 1.693 3.206 1.062 2.463 3.065 2.101 2.021 3.616 6.541ÓXIDO / Oxi<strong>de</strong> 8.828 7.639 7.087 9.141 7.925 7.980 9.672 7.514 8.948 8.320DIV. SALVADORCONCENTRADO / Concentrate 669 573 652 822 819 964 1.259 1.158 1.352 1.740DIV. TENIENTECONCENTRADO / Concentrate 3.178 2.633 2.283 2.443 2.011 2.239 2.029 2.652 3.181 3.385DIV. ANDINACONCENTRADO / Concentrate 1.669 1.292 1.206 1.372 1.681 1.700 1.656 2.002 1.751 1.622TOTAL CODELCO 16.550 13.830 14.434 14.840 14.899 15.948 16.717 15.347 18.848 21.608ANGLO AMERICAN SURCONCENTRADO / Concentrate - - - - - 80 1.172 2.068 2.491 3.689PELAMBRESCONCENTRADO / Concentrate - - - - - - - - - -COLLAHUASICONCENTRADO / Concentrate - - - - - - - - - -VALLE CENTRALCONCENTRADO / Concentrate - - - - - - - - - -TOTAL 16.550 13.830 14.434 14.840 14.899 16.028 17.889 17.415 21.339 25.297(1) Correspon<strong>de</strong> a la producción en las plantas <strong>de</strong> Co<strong>de</strong>lco-Chile y Anglo American Sur. / Inclu<strong>de</strong>s production by Co<strong>de</strong>lco-Chile and Anglo American Sur.Fuente / Source: Comisión Chilena <strong>de</strong>l Cobre / Chilean Copper Commission.20 COCHILCO


