anuario de estadÃsticas del cobre y otros minerales - Comisión ...
anuario de estadÃsticas del cobre y otros minerales - Comisión ...
anuario de estadÃsticas del cobre y otros minerales - Comisión ...
- No tags were found...
You also want an ePaper? Increase the reach of your titles
YUMPU automatically turns print PDFs into web optimized ePapers that Google loves.
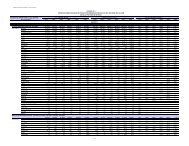
TABLA / TABLE 75PRODUCCIÓN MUNDIAL DE COBRE DE MINAGlobal Copper Mine Production(Miles <strong>de</strong> TM en <strong>cobre</strong> fino) / (kMT Copper Content)1999 2000 2001 2002 2003 2004 2005 2006 2007 2008Chile 4.391,2 4.602,0 4.739,0 4.580,6 4.904,2 5.412,5 5.320,5 5.360,8 5.557,0 5.330,3Estados Unidos / USA 1.600,0 1.444,1 1.340,0 1.140,0 1.115,8 1.160,0 1.140,0 1.197,0 1.190,0 1.339,7Perú / Peru 536,3 553,9 722,4 844,6 842,6 1.035,6 1.009,9 1.048,5 1.190,3 1.267,9China 520,0 592,6 587,4 568,1 604,4 742,2 761,6 872,9 928,0 930,8Australia 737,0 832,0 896,0 879,0 830,0 854,0 930,0 875,0 871,0 885,0Rusia / Russia 510,0 580,0 600,0 685,0 665,1 767,0 804,7 779,4 770,0 784,8Indonesia 790,3 1.005,5 1.047,4 1.162,7 1.003,4 841,6 1.064,2 816,6 788,9 650,5Canadá / Canada 620,1 633,9 633,5 603,5 557,1 562,8 595,4 603,3 596,2 607,0Zambia 271,0 249,3 306,9 307,8 346,9 411,0 465,0 515,6 550,3 595,0Polonia / Poland 463,2 454,1 474,0 502,8 503,2 530,5 511,5 497,1 452,0 436,0Kazajstán / Kazakhstan 373,0 430,2 470,1 473,1 484,5 468,2 435,6 446,3 406,5 419,9Irán / Iran 130,0 147,2 146,3 140,7 146,1 153,0 192,7 217,0 249,2 249,2República Dem.Congo / Dem. Republic Congo 33,0 33,0 33,0 32,3 56,9 69,6 97,7 131,4 144,6 247,2México / Mexico 382,3 364,6 371,1 329,6 355,7 405,5 429,0 334,1 346,8 246,9Brasil / Brazil 31,4 31,8 32,7 32,7 26,3 103,2 133,3 147,8 205,7 213,4Papúa Nueva Guinea / Papua New Guinea 187,9 203,1 203,8 211,3 202,3 173,4 193,0 194,4 169,2 159,7Argentina 210,1 145,2 191,7 204,0 199,0 177,1 187,3 180,1 180,2 156,9Sudáfrica / South Africa 162,9 146,3 141,9 90,0 89,3 85,7 96,6 120,1 159,1 141,9Mongolia 128,2 126,5 136,4 134,7 131,6 130,0 129,0 132,3 133,2 129,4Bulgaria 76,7 93,2 97,1 84,4 80,1 79,6 94,5 110,4 102,7 108,9Uzbekistán / Uzbekistan 60,0 65,0 97,3 80,0 82,0 82,8 103,5 103,5 103,5 103,5Portugal 99,5 76,2 82,9 77,2 77,5 95,7 89,5 78,6 90,2 89,0Laos - - - - - 1,7 30,5 60,8 62,5 89,0Turquía / Turkey 74,0 74,7 74,7 74,7 60,8 49,8 47,8 57,2 65,3 70,6Suecia / Swe<strong>de</strong>n 71,2 77,8 74,3 72,0 83,1 82,4 87,1 86,7 62,9 57,2Mauritania - - - - - - - 5,0 28,8 33,1India 34,1 31,9 32,4 31,5 28,5 29,5 26,7 27,4 33,9 30,5Botswana 21,0 18,7 19,2 21,6 24,3 21,2 26,7 24,3 21,5 19,6Filipinas / Philippines 34,5 30,6 24,2 20,0 20,4 16,0 16,3 17,7 22,9 18,9Georgia 8,0 9,8 11,8 13,1 15,2 13,0 5,8 14,6 11,3 18,7Paquistán / Pakistan - - - - 5,4 14,7 17,7 18,7 18,8 18,7Armenia 9,8 12,2 16,8 16,3 18,1 17,7 16,4 17,0 16,8 17,8Serbia - - - - - - 11,3 13,2 16,5 17,6Oman - - - - - - - - 9,1 16,8Finlandia / Finland 10,5 11,6 11,6 14,4 14,9 15,5 15,0 13,0 13,6 13,3Macedonia 10,2 10,0 6,8 5,6 0,7 - 5,7 8,4 8,4 9,6Marruecos / Morocco 7,1 6,5 5,3 5,0 4,9 4,4 2,8 4,5 6,3 8,3Namibia - 5,1 14,5 18,0 16,2 13,5 10,2 6,3 5,8 7,5España / Spain 2,7 23,3 9,7 1,2 0,6 1,4 7,9 8,7 6,3 7,1Myanmar 26,7 26,7 25,8 27,5 27,9 31,8 34,5 19,5 15,1 6,9Vietnam 0,7 2,4 1,6 1,1 1,2 2,0 3,1 11,4 12,5 5,8Albania 0,9 - - - - - 1,7 0,4 1,3 3,7Arabia Saudita / Saudi Arabia 0,8 0,8 0,8 0,6 0,6 0,7 0,7 0,7 0,7 3,6Zimbabwe 5,0 0,6 2,1 2,5 2,8 2,4 2,6 2,7 3,0 3,0Chipre / Cyprus 5,0 5,2 5,2 3,6 2,5 1,3 - 0,9 3,0 3,0Tanzania - - 3,6 4,2 3,7 4,3 3,7 4,0 3,2 2,5Colombia 2,3 2,1 2,2 1,9 1,6 1,7 1,9 0,6 1,2 2,4Bolivia 0,3 0,1 0,0 0,1 0,3 0,6 0,7 0,2 0,6 0,8Rumania / Romania 16,8 16,1 19,2 19,6 21,3 18,8 14,9 12,2 2,1 0,3Yugoslavia 69,5 56,1 31,0 34,6 24,8 23,9 - - - -Malasia / Malaysia 10,2 - - - - - - - - -Japón / Japan 1,0 1,2 0,7 - - - - - - -Cuba 1,1 1,3 0,3 - - - - - - -OTROS / Other 12,0 12,0 12,0 12,0 12,0 12,0 12,0 12,0 12,0 12,0TOTAL 12.749,4 13.246,5 13.756,7 13.565,4 13.696,1 14.721,1 15.188,3 15.210,4 15.649,9 15.591,0Fuente / Source: -World Metal Statistics March 2009 and Yearbook 2008.-Comisión Chilena <strong>de</strong>l Cobre: Cifras <strong>de</strong> Producción <strong>de</strong> Chile / Chile data: Chilean Copper Commission.134 COCHILCO


