

anuario de estadÃsticas del cobre y otros minerales - Comisión ...
anuario de estadÃsticas del cobre y otros minerales - Comisión ...
anuario de estadÃsticas del cobre y otros minerales - Comisión ...
- No tags were found...

Create successful ePaper yourself
Turn your PDF publications into a flip-book with our unique Google optimized e-Paper software.
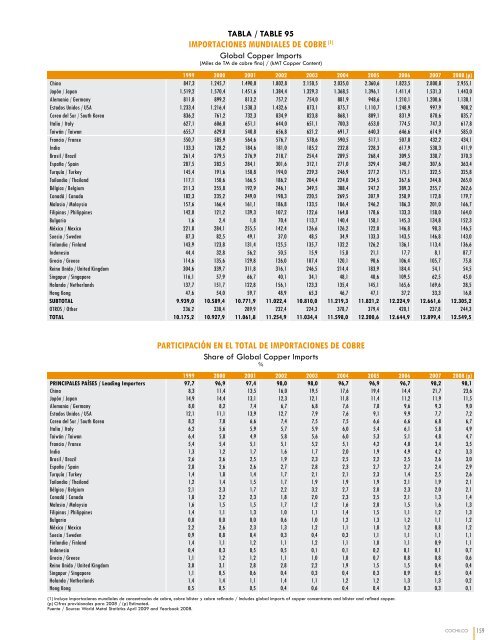
TABLA / TABLE 95IMPORTACIONES MUNDIALES DE COBRE (1)Global Copper Imports(Miles <strong>de</strong> TM <strong>de</strong> <strong>cobre</strong> fino) / (kMT Copper Content)1999 2000 2001 2002 2003 2004 2005 2006 2007 2008 (p)China 847,3 1.245,7 1.490,0 1.802,8 2.150,5 2.035,0 2.360,6 1.823,5 2.800,8 2.955,1Japón / Japan 1.519,2 1.570,4 1.451,6 1.384,4 1.329,3 1.368,5 1.396,1 1.411,4 1.531,3 1.443,0Alemania / Germany 811,8 899,2 813,2 757,2 754,0 881,9 948,6 1.210,1 1.200,6 1.130,1Estados Unidos / USA 1.233,4 1.216,4 1.538,3 1.432,6 873,1 875,7 1.110,7 1.248,9 997,9 908,2Corea <strong>de</strong>l Sur / South Korea 836,2 761,2 732,3 834,9 823,8 868,1 809,1 831,9 870,6 835,7Italia / Italy 627,1 606,0 651,1 644,0 651,1 700,3 653,0 774,5 747,3 617,8Taiwán / Taiwan 655,7 629,0 540,8 656,8 621,2 691,7 640,3 646,6 614,9 585,0Francia / France 550,7 585,9 564,6 576,7 578,6 590,5 517,1 507,0 432,2 434,1India 133,3 128,2 184,6 181,0 185,2 232,8 228,3 617,9 538,3 411,9Brasil / Brazil 261,4 279,5 276,9 218,7 254,4 289,5 268,4 309,5 338,7 370,3España / Spain 287,5 282,5 284,1 301,6 312,1 271,0 329,4 340,7 307,6 363,4Turquía / Turkey 145,4 191,6 150,8 194,0 229,3 246,9 277,2 175,1 322,5 325,8Tailandia / Thailand 117,1 150,6 166,5 186,2 204,4 224,0 234,5 267,6 244,8 265,0Bélgica / Belgium 211,3 255,8 192,9 246,1 349,5 308,4 247,2 289,3 255,7 262,6Canadá / Canada 182,3 235,2 249,0 198,3 220,5 269,5 307,9 258,9 172,8 179,7Malasia / Malaysia 157,6 166,4 161,1 186,8 133,5 186,4 246,2 186,3 201,0 166,7Filipinas / Philippines 142,0 121,2 139,3 107,2 122,6 164,8 178,6 133,3 158,0 164,0Bulgaria 1,6 2,4 1,8 70,4 113,7 140,4 158,1 145,3 134,8 152,3México / Mexico 221,8 284,1 255,5 142,4 126,6 126,2 122,0 146,8 98,3 146,5Suecia / Swe<strong>de</strong>n 87,3 82,5 49,1 37,0 48,5 34,9 133,3 143,5 146,8 143,0Finlandia / Finland 143,9 123,8 131,4 125,5 135,7 132,2 126,2 136,1 113,4 136,6Indonesia 44,4 32,8 56,2 50,5 15,9 15,8 21,1 17,7 8,1 87,7Grecia / Greece 114,6 135,6 129,8 126,0 107,4 120,1 90,6 106,4 105,7 75,8Reino Unido / United Kingdom 304,6 339,7 311,8 316,1 246,5 214,4 183,9 184,4 54,1 54,5Singapur / Singapore 116,1 57,9 66,7 40,1 34,1 48,1 40,6 109,5 62,5 45,0Holanda / Netherlands 137,7 151,7 122,8 156,1 123,3 135,4 145,1 165,6 169,6 28,5Hong Kong 47,6 54,0 59,7 48,9 65,3 46,7 47,1 37,2 33,3 16,8SUBTOTAL 9.939,0 10.589,4 10.771,9 11.022,4 10.810,0 11.219,3 11.821,2 12.224,9 12.661,6 12.305,2OTROS / Other 236,2 338,4 289,9 232,4 224,3 378,7 379,4 420,1 237,8 244,3TOTAL 10.175,2 10.927,9 11.061,8 11.254,9 11.034,4 11.598,0 12.200,6 12.644,9 12.899,4 12.549,5PARTICIPACIÓN EN EL TOTAL DE IMPORTACIONES DE COBREShare of Global Copper Imports%1999 2000 2001 2002 2003 2004 2005 2006 2007 2008 (p)PRINCIPALES PAÍSES / Leading Importers 97,7 96,9 97,4 98,0 98,0 96,7 96,9 96,7 98,2 98,1China 8,3 11,4 13,5 16,0 19,5 17,6 19,4 14,4 21,7 23,6Japón / Japan 14,9 14,4 13,1 12,3 12,1 11,8 11,4 11,2 11,9 11,5Alemania / Germany 8,0 8,2 7,4 6,7 6,8 7,6 7,8 9,6 9,3 9,0Estados Unidos / USA 12,1 11,1 13,9 12,7 7,9 7,6 9,1 9,9 7,7 7,2Corea <strong>de</strong>l Sur / South Korea 8,2 7,0 6,6 7,4 7,5 7,5 6,6 6,6 6,8 6,7Italia / Italy 6,2 5,6 5,9 5,7 5,9 6,0 5,4 6,1 5,8 4,9Taiwán / Taiwan 6,4 5,8 4,9 5,8 5,6 6,0 5,3 5,1 4,8 4,7Francia / France 5,4 5,4 5,1 5,1 5,2 5,1 4,2 4,0 3,4 3,5India 1,3 1,2 1,7 1,6 1,7 2,0 1,9 4,9 4,2 3,3Brasil / Brazil 2,6 2,6 2,5 1,9 2,3 2,5 2,2 2,5 2,6 3,0España / Spain 2,8 2,6 2,6 2,7 2,8 2,3 2,7 2,7 2,4 2,9Turquía / Turkey 1,4 1,8 1,4 1,7 2,1 2,1 2,3 1,4 2,5 2,6Tailandia / Thailand 1,2 1,4 1,5 1,7 1,9 1,9 1,9 2,1 1,9 2,1Bélgica / Belgium 2,1 2,3 1,7 2,2 3,2 2,7 2,0 2,3 2,0 2,1Canadá / Canada 1,8 2,2 2,3 1,8 2,0 2,3 2,5 2,1 1,3 1,4Malasia / Malaysia 1,6 1,5 1,5 1,7 1,2 1,6 2,0 1,5 1,6 1,3Filipinas / Philippines 1,4 1,1 1,3 1,0 1,1 1,4 1,5 1,1 1,2 1,3Bulgaria 0,0 0,0 0,0 0,6 1,0 1,2 1,3 1,2 1,1 1,2México / Mexico 2,2 2,6 2,3 1,3 1,2 1,1 1,0 1,2 0,8 1,2Suecia / Swe<strong>de</strong>n 0,9 0,8 0,4 0,3 0,4 0,3 1,1 1,1 1,1 1,1Finlandia / Finland 1,4 1,1 1,2 1,1 1,2 1,1 1,0 1,1 0,9 1,1Indonesia 0,4 0,3 0,5 0,5 0,1 0,1 0,2 0,1 0,1 0,7Grecia / Greece 1,1 1,2 1,2 1,1 1,0 1,0 0,7 0,8 0,8 0,6Reino Unido / United Kingdom 3,0 3,1 2,8 2,8 2,2 1,9 1,5 1,5 0,4 0,4Singapur / Singapore 1,1 0,5 0,6 0,4 0,3 0,4 0,3 0,9 0,5 0,4Holanda / Netherlands 1,4 1,4 1,1 1,4 1,1 1,2 1,2 1,3 1,3 0,2Hong Kong 0,5 0,5 0,5 0,4 0,6 0,4 0,4 0,3 0,3 0,1(1) Incluye importaciones mundiales <strong>de</strong> concentrados <strong>de</strong> <strong>cobre</strong>, <strong>cobre</strong> blister y <strong>cobre</strong> refinado / Inclu<strong>de</strong>s global imports of copper concentrates and blister and refined copper.(p) Cifras provisionales para 2008 / (p) Estimated.Fuente / Source: World Metal Statistics April 2009 and Yearbook 2008.COCHILCO159


