anuario de estadÃsticas del cobre y otros minerales - Comisión ...
anuario de estadÃsticas del cobre y otros minerales - Comisión ...
anuario de estadÃsticas del cobre y otros minerales - Comisión ...
- No tags were found...
You also want an ePaper? Increase the reach of your titles
YUMPU automatically turns print PDFs into web optimized ePapers that Google loves.
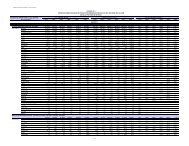
TABLA / TABLE 77PRODUCCIÓN MUNDIAL DE COBRE DE FUNDICIÓNGlobal Copper Smelter Production(Miles <strong>de</strong> TM en <strong>cobre</strong> fino) / (kMT Copper Content)1999 2000 2001 2002 2003 2004 2005 2006 2007 2008China 837,0 1.013,9 1.145,1 1.179,9 1.379,2 1.502,9 1.751,5 1.917,5 2.111,5 2.495,5Japón / Japan 1.389,5 1.480,6 1.444,5 1.499,4 1.516,1 1.465,4 1.517,8 1.628,3 1.612,5 1.625,4Chile 1.473,9 1.460,4 1.503,2 1.438,7 1.542,4 1.517,6 1.558,1 1.565,4 1.514,3 1.369,2Rusia / Russia 758,0 758,0 758,0 800,0 790,0 850,0 850,0 850,0 850,0 850,0India 224,0 225,6 288,6 380,0 390,0 400,0 523,7 629,0 713,9 660,9Estados Unidos / USA 1.290,0 1.002,0 919,0 683,1 539,0 542,0 523,0 500,8 617,0 550,1Alemania / Germany 330,0 571,6 558,6 578,2 494,1 541,2 510,0 510,0 510,0 510,0Canadá / Canada 617,0 603,7 643,0 538,7 456,9 476,2 471,9 520,5 516,8 487,1Polonia / Poland 493,5 482,5 513,8 540,1 584,1 580,5 583,9 589,4 558,6 470,8Australia 335,9 386,9 459,6 468,1 435,0 443,0 412,0 377,0 399,0 447,0Kazajstán / Kazakhstan 384,2 414,9 433,3 446,2 431,9 444,5 404,8 424,8 392,8 392,3Corea <strong>de</strong>l Sur / South Korea 390,0 370,0 390,0 390,0 410,0 390,0 390,0 390,0 390,0 390,0Zambia 289,0 308,3 306,0 311,4 320,4 320,4 320,4 384,0 384,0 384,0Perú / Peru 350,4 340,4 392,3 379,6 376,1 377,8 381,6 381,3 296,1 360,4Bulgaria 112,2 175,6 146,3 181,0 215,3 227,1 240,1 238,5 229,0 278,2España / Spain 318,5 329,8 304,6 298,0 290,3 224,3 284,4 263,7 256,3 259,9Indonesia 126,7 173,8 217,5 211,2 247,4 211,6 275,0 201,2 221,4 255,0Filipinas / Philippines 162,0 160,0 216,6 137,8 111,6 120,0 201,3 239,6 220,0 246,7Irán / Iran 120,0 135,0 110,0 96,0 96,0 173,4 190,0 244,0 250,0 245,6Brasil / Brazil 193,0 185,3 212,2 189,7 219,6 219,6 199,0 219,7 218,4 217,7Suecia / Swe<strong>de</strong>n 105,6 133,1 219,8 224,4 215,0 235,6 223,5 194,2 204,0 202,5México / Mexico 371,4 326,8 347,8 263,4 220,1 271,0 301,2 260,2 222,6 153,4Finlandia / Finland 149,6 155,4 169,3 160,9 160,6 151,6 157,9 164,3 118,9 139,6Bélgica / Belgium 142,8 144,7 138,2 125,9 120,2 107,7 113,0 104,0 115,0 115,9Uzbekistán / Uzbekistan 72,0 75,0 97,3 80,0 82,0 84,9 115,0 115,0 115,0 115,0Sudáfrica / South Africa 149,3 136,1 121,2 117,0 112,0 89,3 100,5 102,6 110,7 95,9Austria 83,0 78,7 68,6 64,9 65,1 59,1 52,2 46,1 54,7 67,1Serbia - - - - - - 38,9 46,8 39,1 40,2Turquía / Turkey 32,9 30,0 24,8 19,4 18,4 34,7 27,7 26,3 17,9 38,0Noruega / Norway 33,3 27,0 26,7 30,5 35,9 35,6 38,7 39,7 34,2 37,0Eslovaquia / Slovakia - - - - 5,8 13,2 15,5 22,0 20,6 27,5Paquistán / Pakistan - - - - 4,9 13,0 18,6 23,6 18,2 17,8Namibia - 5,1 27,7 24,7 26,3 24,4 22,6 22,7 20,4 14,9Omán / Oman 17,1 24,3 21,7 24,0 17,0 17,1 24,5 20,7 13,9 13,6Armenia 0,5 7,2 7,0 6,5 6,2 9,4 9,8 8,8 7,0 6,5Zimbabwe 14,5 14,5 5,3 5,4 5,0 5,8 6,0 6,7 6,0 6,0República Dem. Congo / Dem. Republic Congo 29,0 29,0 29,0 - - 0,2 4,5 3,2 0,1 0,2Tailandia / Thailand - - - - - 21,5 25,0 2,5 7,6 -Yugoslavia 53,9 54,0 54,0 41,8 17,5 20,4 - - - -Rumania / Romania 24,0 16,2 9,2 8,8 4,5 0,2 - - - -Albania 0,1 - - - - - - - - -OTROS / Other 20,0 20,0 20,0 20,0 20,0 20,0 20,0 20,0 20,0 20,0TOTAL 11.493,8 11.855,4 12.350,0 11.964,5 11.981,9 12.242,3 12.903,7 13.304,0 13.407,5 13.606,8Fuente / Source: -World Metal Statistics March 2009 and Yearbook 2008.-Comisión Chilena <strong>de</strong>l Cobre: Cifras <strong>de</strong> Producción <strong>de</strong> Chile / Chile data: Chilean Copper Commission.136 COCHILCO


