anuario de estadÃsticas del cobre y otros minerales - Comisión ...
anuario de estadÃsticas del cobre y otros minerales - Comisión ...
anuario de estadÃsticas del cobre y otros minerales - Comisión ...
- No tags were found...
Create successful ePaper yourself
Turn your PDF publications into a flip-book with our unique Google optimized e-Paper software.
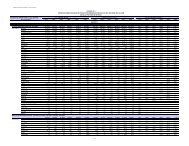
TABLA / TABLE 94PARTICIPACIÓN EN LAS EXPORTACIONES DE COBRE POR PRODUCTOShare of Copper Exports By Product Type(%)1999 2000 2001 2002 2003 2004 2005 2006 2007 2008 (p)A. REFINADO / RefinedChile 37,7 37,7 36,9 39,0 37,2 42,0 37,6 34,9 38,2 40,0Zambia 3,0 3,2 4,2 4,8 5,2 5,6 5,7 6,4 6,4 7,9Japón /Japan 4,7 4,4 5,7 5,3 4,1 2,8 3,3 4,3 5,6 5,7Perú / Peru 6,1 5,6 5,9 5,8 6,5 4,5 6,9 6,0 4,8 5,6Australia 3,8 4,8 5,4 5,1 4,6 4,6 4,2 3,8 3,9 4,8Kazakhstan / Kazakhstan 5,2 5,8 5,5 5,5 5,3 5,6 5,4 4,8 4,6 -Polonia /Poland 3,3 3,6 3,1 3,7 4,0 4,0 3,9 3,9 3,1 4,0Canadá /Canada 4,3 4,3 4,2 3,4 3,2 4,1 4,0 3,7 3,9 3,9Bélgica /Belgium 2,5 3,0 3,3 2,8 4,8 2,4 3,2 3,2 2,6 3,5Rusia / Russia 9,4 9,6 8,9 7,1 5,6 5,1 4,0 3,5 3,6 2,8Filipinas / Philippines 2,1 1,9 2,2 2,0 2,4 2,3 1,5 2,4 2,4 2,4India 0,0 0,4 0,5 1,3 1,5 1,8 2,0 3,2 2,8 2,1Indonesia 1,2 2,0 2,3 1,9 2,8 1,3 3,8 1,5 2,2 1,9Corea <strong>de</strong>l sur/ South Korea 2,2 0,4 0,1 0,2 0,6 0,7 1,2 1,9 1,8 1,7Alemania / Germany 2,1 1,4 1,5 1,3 1,7 2,0 2,0 2,0 1,5 1,7Austria 1,3 1,6 1,2 1,1 1,2 1,0 1,1 1,1 1,1 1,5China 1,4 1,7 0,7 1,1 0,9 1,8 1,9 3,3 1,7 1,3Bulgaria 0,3 0,4 0,4 0,6 0,6 0,7 0,5 0,5 0,5 1,3Brasil/ Brazil 0,3 0,2 0,2 0,7 0,3 0,3 0,4 0,8 1,3 1,3España/ Spain 1,4 0,9 0,3 0,3 0,7 0,5 0,6 0,5 0,6 1,2Suecia / Swe<strong>de</strong>n 0,2 0,2 1,0 1,3 1,1 1,2 1,3 1,2 0,9 0,9Finlandia / Finland 0,5 0,3 0,3 0,5 0,5 0,4 0,5 0,7 0,4 0,9Singapur / Singapore 2,0 1,1 0,8 0,8 0,5 0,6 0,5 1,3 0,9 0,6Estados Unidos / USA 0,4 1,4 0,3 0,4 1,8 1,8 0,7 1,7 0,7 0,5México / Mexico 1,5 1,1 1,8 0,8 0,3 0,3 0,5 0,8 0,8 0,4Sudáfrica / South Africa 0,7 0,4 0,5 0,3 0,2 0,1 0,3 0,3 0,2 0,2SUBTOTAL 97,5 97,3 97,1 97,0 97,5 97,2 97,0 97,3 96,6 97,9OTROS / Other 2,5 2,7 2,9 3,0 2,5 2,8 3,0 2,7 3,4 2,1TOTAL 100,0 100,0 100,0 100,0 100,0 100,0 100,0 100,0 100,0 100,0B. BLÍSTER / BlisterChile 30,3 28,1 21,8 26,6 35,8 42,1 41,3 48,9 54,7 47,3Bulgaria 13,6 23,8 16,8 18,8 22,5 19,6 21,1 18,0 15,1 17,0Canadá /Canada 14,4 8,7 11,3 12,3 10,9 8,7 10,4 9,5 10,4 9,9España / Spain 4,6 4,4 5,0 3,1 4,9 5,9 7,4 4,9 4,0 4,8Finlandia / Finland 5,8 6,7 7,3 6,3 4,3 2,9 3,5 3,7 1,1 3,1Estados Unidos / USA 5,9 4,0 3,8 5,0 4,6 5,4 5,0 2,0 1,7 2,7México / Mexico 5,6 3,5 3,4 2,7 2,1 2,5 2,1 2,1 2,6 1,6Japón /Japan 6,9 6,9 6,4 7,4 1,3 0,9 1,4 1,0 1,1 1,5Bélgica / Belgium 2,2 2,9 1,7 0,5 1,4 2,3 0,5 1,0 1,2 1,3Perú / Peru 5,5 3,8 4,4 3,6 2,8 - - 1,7 2,7 1,2China 0,6 0,4 0,3 0,5 0,2 0,2 0,4 0,3 0,0 0,7Sudáfrica / South Africa - 0,1 4,9 3,7 1,6 0,1 0,7 0,7 0,9 0,4Kazakhstan / Kazakhstan - 1,0 1,3 1,1 0,7 1,2 0,8 0,3 - -Rusia / Russia 1,1 0,6 - - - - - - - -SUBTOTAL 96,4 94,8 88,4 91,6 93,0 91,6 94,6 94,1 95,4 91,5OTROS / Other 3,7 5,2 11,6 8,4 7,0 8,4 5,4 5,9 4,6 8,5TOTAL 100,0 100,0 100,0 100,0 100,0 100,0 100,0 100,0 100,0 100,0C. GRANELES / BulkChile 43,8 42,2 41,9 38,8 44,5 48,3 43,2 42,4 41,1 36,6Perú / Peru 1,4 1,9 2,2 9,3 7,0 11,2 10,3 9,0 13,4 14,1Australia 7,3 6,2 7,3 7,2 8,4 6,6 7,9 7,7 6,9 8,2Indonesia 13,7 15,5 15,1 18,0 14,8 10,1 11,8 11,4 7,9 7,4Canadá / Canada 7,5 11,6 14,5 7,1 4,2 3,7 5,1 4,5 3,9 6,4Estados Unidos / USA 2,1 4,2 1,1 0,6 0,3 0,5 2,7 7,5 5,5 5,5Sudáfrica / South Africa 0,3 0,0 0,2 0,1 0,1 0,2 0,2 0,6 1,1 4,8Papúa Nueva Guinea / Papua New Guinea 5,2 4,5 4,4 4,4 5,5 3,6 4,0 3,4 3,4 3,0Brasil/ Brazil 0,0 - - - - 1,3 1,9 1,8 2,6 2,9Argentina 5,1 3,0 3,8 4,5 4,2 3,9 3,4 3,3 3,1 2,9Mongolia 3,5 3,0 2,7 3,4 3,5 3,1 2,9 2,9 2,8 2,7Portugal 3,1 2,0 2,2 1,2 1,8 1,9 1,9 1,6 1,8 1,7México / Mexico 0,5 1,9 0,6 0,9 0,9 1,3 0,7 0,6 0,8 0,9Bulgaria 1,0 0,6 0,6 0,5 0,5 0,4 0,6 0,9 0,8 0,5Filipinas / Philippines 1,0 0,5 0,3 0,3 0,2 0,2 0,3 0,3 0,5 0,5Rusia / Russia 0,2 0,2 0,1 0,1 0,0 0,4 0,5 - 0,1 0,1Kazakhstan / Kazakhstan 0,1 0,7 0,4 1,0 1,4 1,5 0,6 0,4 1,0 -España /Spain 0,6 0,2 0,5 0,0 0,0 0,0 0,1 0,0 0,0 0,0Suecia / Swe<strong>de</strong>n 0,2 0,2 0,1 - 0,0 0,0 - 0,0 - 0,0SUBTOTAL 96,7 98,2 97,8 97,4 97,1 98,2 98,0 98,3 96,5 97,9OTROS / Other 3,3 1,8 2,2 2,6 2,9 1,8 2,0 1,7 3,5 2,1TOTAL 100,0 100,0 100,0 100,0 100,0 100,0 100,0 100,0 100,0 100,0(p) Cifras provisionales para 2008 / (p) Estimated.Fuente / Source: Tabla / Table 93.158 COCHILCO


