anuario de estadÃsticas del cobre y otros minerales - Comisión ...
anuario de estadÃsticas del cobre y otros minerales - Comisión ...
anuario de estadÃsticas del cobre y otros minerales - Comisión ...
- No tags were found...
Create successful ePaper yourself
Turn your PDF publications into a flip-book with our unique Google optimized e-Paper software.
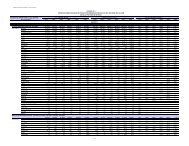
TABLA / TABLE 85CONSUMO MUNDIAL DE COBRE REFINADOGlobal Refined Copper Consumption(Miles <strong>de</strong> TM <strong>de</strong> <strong>cobre</strong> fino) / (kMT Copper Content)1999 2000 2001 2002 2003 2004 2005 2006 2007 2008China 1.484,2 1.928,1 2.307,3 2.736,9 3.083,7 3.363,9 3.656,1 3.613,8 4.863,4 5.133,6Estados Unidos / USA 2.984,6 3.025,5 2.619,0 2.364,1 2.290,0 2.410,0 2.256,8 2.096,0 2.140,0 1.913,6Alemania / Germany 1.138,2 1.307,1 1.119,6 1.066,7 1.009,6 1.100,2 1.114,6 1.397,6 1.391,8 1.386,5Japón / Japan 1.293,2 1.349,2 1.144,7 1.163,9 1.202,3 1.278,6 1.228,9 1.282,3 1.251,9 1.184,4Corea <strong>de</strong>l Sur / South Korea 783,9 862,2 848,5 936,3 900,5 939,5 868,5 827,9 857,6 851,6Rusia / Russia 170,0 183,0 223,8 355,0 422,4 549,7 667,2 693,3 687,8 730,8Italia / Italy 635,0 673,9 676,0 672,7 664,7 715,0 680,5 800,5 763,6 638,2Taiwán / Taiwan 655,1 628,4 540,0 655,8 619,2 689,5 638,4 642,5 603,0 582,3India 262,6 240,2 292,6 295,1 307,5 334,8 397,2 406,7 516,1 514,6Brasil / Brazil 287,7 331,2 345,0 236,7 300,2 324,8 335,2 339,1 330,0 383,2Francia / France 550,0 574,2 537,7 561,2 551,3 535,8 472,2 460,5 336,5 379,1Turquía / Turkey 201,0 248,0 194,2 225,2 264,9 280,9 316,2 301,9 390,7 376,6México / Mexico 395,0 463,9 436,8 382,8 352,9 393,8 402,0 348,0 344,6 318,0Bélgica / Belgium 353,3 347,0 312,0 274,8 272,0 310,0 320,4 290,0 310,0 310,0España / Spain 255,3 289,3 299,1 326,5 311,6 331,0 292,0 284,7 279,7 270,3Tailandia / Thailand 117,1 150,6 166,5 186,2 204,4 247,3 240,8 250,6 206,4 255,5Polonia / Poland 249,6 246,3 271,9 246,5 253,3 274,3 270,5 274,5 300,5 243,8Malasia / Malaysia 157,6 166,2 159,9 185,4 133,1 185,7 224,4 224,4 224,4 224,4Indonesia 56,4 59,8 104,3 108,6 121,4 188,0 180,0 185,2 205,2 205,2Canadá / Canada 266,5 272,1 265,2 274,1 257,3 297,2 289,7 301,5 206,0 196,4Egipto / Egypt 10,0 19,0 34,3 36,0 36,0 45,0 75,0 100,0 107,8 196,1Suecia / Swe<strong>de</strong>n 176,6 203,3 194,6 169,5 185,4 188,7 163,8 183,6 179,5 183,6Arabia Saudita / Saudi Arabia 160,0 160,0 160,0 160,0 159,6 159,6 159,6 159,6 159,6 159,6Australia 164,4 165,2 163,2 188,5 184,3 168,5 157,5 143,7 147,9 154,0Irán / Iran 95,0 101,7 95,0 95,0 94,8 120,0 94,8 125,5 144,3 144,0Chile 75,2 83,0 90,0 81,5 94,7 100,4 102,7 110,7 105,3 103,2Kazajstán / Kazakhstan 16,0 16,0 27,3 64,5 56,8 54,6 48,5 72,0 62,3 84,0Sudáfrica / South Africa 68,0 82,8 74,4 80,3 74,5 85,6 87,5 83,0 82,8 82,8Grecia / Greece 114,6 134,6 129,7 125,7 106,0 118,2 89,3 103,9 103,7 81,0Bulgaria 14,3 14,4 14,4 14,4 14,4 15,2 38,4 45,5 59,4 72,0Finlandia / Finland 115,8 115,7 101,1 89,1 101,5 104,7 92,9 82,7 79,7 58,9Vietnam 2,5 17,3 25,2 29,3 42,0 56,0 53,6 76,1 93,2 56,3Perú / Peru 55,0 55,0 55,0 55,0 55,0 55,0 55,0 55,0 55,0 55,0Holanda / Netherlands 50,0 53,2 50,0 50,0 50,0 50,4 50,4 50,4 50,4 50,4Rumania / Romania 17,9 15,9 10,8 10,8 17,5 28,3 23,8 26,2 42,2 37,5Uzbekistán / Uzbekistan 10,0 10,0 10,0 15,0 20,0 26,8 26,8 26,8 35,7 35,7Filipinas / Philippines 35,0 35,0 34,3 35,0 33,2 34,0 34,0 34,0 34,0 34,0Austria 34,0 34,0 34,0 34,0 34,0 34,0 34,0 34,0 34,0 34,0Argentina 43,6 48,9 40,0 20,4 27,7 33,1 33,6 30,4 30,6 30,4Reino Unido / United Kingdom 305,3 322,7 285,9 260,7 242,2 243,4 165,4 172,1 41,5 26,2Serbia - - - - - - 23,0 22,8 22,8 22,8Ucrania / Ukraine 3,0 3,0 3,0 3,0 6,0 15,7 24,0 21,0 26,0 21,8Zambia 16,0 13,0 15,6 15,6 15,6 15,6 15,6 21,0 21,6 21,6Paquistán / Pakistan 9,6 9,6 12,0 16,8 14,8 17,4 18,0 21,6 16,0 16,0Corea <strong>de</strong>l Norte / North Korea 15,0 16,0 15,6 15,6 15,6 20,8 14,4 14,4 14,4 14,4Kuwait 10,9 7,0 8,1 8,0 10,5 10,6 10,6 10,6 10,6 10,6Zimbabwe 10,0 10,0 10,0 10,0 10,0 10,0 10,0 10,0 10,0 10,0Singapur / Singapore 10,0 10,0 10,0 10,0 10,0 10,0 10,0 10,0 10,0 10,0Venezuela 23,0 1,2 1,3 0,7 1,2 4,4 4,3 8,3 6,8 9,5República Checa / Czech Republic 19,0 19,0 16,8 10,4 3,8 8,4 6,1 6,7 6,2 6,8Colombia 2,0 4,5 4,7 7,6 8,7 11,0 12,8 12,4 9,4 6,5Suiza / Switzerland 7,5 7,6 8,5 5,8 5,1 5,7 4,6 4,7 5,8 5,9Hong Kong 4,8 4,8 4,8 4,8 4,8 4,8 4,8 4,8 4,8 4,8Túnez / Tunisia 3,1 4,3 5,1 3,8 3,2 4,0 3,8 3,0 2,2 4,8Eslovaquia / Slovakia 1,2 0,9 16,9 18,0 4,1 1,0 1,1 1,6 1,6 1,6Hungría / Hungary 17,5 19,7 18,5 15,7 11,8 8,1 1,0 0,7 1,1 1,4Portugal 0,4 0,4 0,1 0,4 1,2 1,5 0,0 0,2 0,6 1,0Nueva Zelandia / New Zealand 6,2 2,7 8,1 0,8 0,0 0,1 0,0 0,0 0,0 0,0Yugoslavia 19,6 8,3 12,0 12,0 12,0 20,0 - - - -OTROS / Other 18,4 16,1 21,2 23,4 25,4 23,8 36,5 64,6 70,3 77,9TOTAL 14.056,7 15.191,9 14.685,6 15.051,5 15.315,7 16.664,4 16.638,8 16.974,4 18.098,4 18.024,2Fuente / Source: -World Metal Statistics March 2009 and Yearbook 2008.-Comisión Chilena <strong>de</strong>l Cobre: Cifras <strong>de</strong> Consumo <strong>de</strong> Chile. / Chile data: Chilean Copper Commission.146 COCHILCO


