anuario de estadÃsticas del cobre y otros minerales - Comisión ...
anuario de estadÃsticas del cobre y otros minerales - Comisión ...
anuario de estadÃsticas del cobre y otros minerales - Comisión ...
- No tags were found...
Create successful ePaper yourself
Turn your PDF publications into a flip-book with our unique Google optimized e-Paper software.
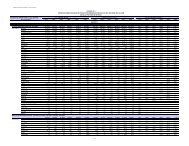
TABLA / TABLE 2.1PRODUCCIÓN CHILENA DE COBRE COMERCIABLE POR EMPRESAS Y PRODUCTOSCopper Production by Company and Product Type(Miles <strong>de</strong> TM <strong>de</strong> <strong>cobre</strong> fino) / (kMT Copper Content)I) POR EMPRESAS / By Company 1989 1990 1991 1992 1993 1994 1995 1996 1997 1998Co<strong>de</strong>lco-Chile 1.243,1 1.195,3 1.125,5 1.156,3 1.139,4 1.134,1 1.164,7 1.221,3 1.231,2 1.402,8División Co<strong>de</strong>lco Norte 660,4 680,7 641,4 628,2 616,7 606,2 610,2 632,3 654,2 812,1División Salvador 129,9 95,0 91,1 85,0 84,1 82,6 85,9 89,9 88,3 88,1División Andina 124,3 119,1 114,2 128,9 133,9 136,4 145,8 154,4 145,5 164,0División El Teniente 328,5 300,5 278,8 314,2 304,7 308,9 322,8 344,7 343,2 338,6OTROS PRODUCTORES / Other Producers 366,2 393,1 688,8 776,4 916,0 1.085,8 1.323,9 1.894,5 2.160,8 2.284,1Anglo American Norte 74,5 72,5 78,5 69,4 74,9 77,5 76,0 122,4 132,9 138,1Anglo American Sur 112,3 112,2 107,2 131,9 181,4 187,7 198,5 200,7 202,4 215,9Escondida - 8,9 298,4 336,1 388,8 483,6 466,9 841,4 932,7 867,6Compañía Minera El Indio (1) 27,0 26,8 26,6 24,8 28,4 31,5 34,6 34,7 32,1 27,8Michilla - - - - - 26,8 56,4 63,0 62,7 62,1Can<strong>de</strong>laria - - - - - 30,9 150,3 136,8 155,7 215,0Cerro Colorado - - - - - 21,3 36,4 59,3 60,3 75,0Quebrada Blanca - - - - - 6,9 46,4 67,7 66,8 71,1Zaldívar - - - - - - 22,4 77,5 96,2 135,0El Abra - - - - - - - 51,0 194,1 198,7Collahuasi - - - - - - - - - 48,1Lomas Bayas - - - - - - - - - 19,3Los Pelambres - - - - - - - - - -El Tesoro - - - - - - - - - -Spence - - - - - - - - - -Gaby - - - - - - - - - -OTROS / Other 152,4 172,7 178,1 214,2 242,5 219,6 236,0 240,0 224,9 210,4TOTAL 1.609,3 1.588,4 1.814,3 1.932,7 2.055,4 2.219,9 2.488,6 3.115,8 3.392,0 3.686,9II) POR PRODUCTOS / By Product Type 1989 1990 1991 1992 1993 1994 1995 1996 1997 1998PRODUCCIÓN DE MINA / Mine Production 1.609,3 1.588,4 1.814,3 1.932,7 2.055,4 2.219,9 2.488,6 3.115,8 3.392,0 3.686,9PRODUCCIÓN DE FUNDICIÓN / Smelter Production 1.266,6 1.206,4 1.176,0 1.191,0 1.234,0 1.259,4 1.293,7 1.355,6 1.389,6 1.403,1PRODUCCIÓN DE REFINADO / Refined Production 1.071,0 1.191,6 1.228,3 1.242,3 1.268,2 1.277,4 1.491,5 1.748,2 2.116,6 2.334,9Electrolítico / Electrolytic 907,4(2) (2) (2) (2) (2) (2) (2) (2) (2)Cátodos SX-EW / SX-EW catho<strong>de</strong>s - 122,1 120,1 135,5 155,1 201,0 372,5 635,7 881,0 1.108,1Cátodos E.R. / ER catho<strong>de</strong>s - 955,6 967,2 952,6 953,8 932,6 972,4 993,7 1.110,8 1.098,0Refinado a fuego / Fire refined 137,9 89,7 115,4 129,1 133,3 120,2 122,7 118,8 124,8 128,8Refinado Mantos Blancos / Mantos Blancos Refined 25,7 24,2 25,6 25,1 26,0 23,6 23,9 - - -(1) Consi<strong>de</strong>ra el <strong>cobre</strong> contenido en la producción <strong>de</strong> <strong>minerales</strong> y concentrados <strong>de</strong> oro. / Inclu<strong>de</strong>s copper contained in gold ore and concentrate production.(2) A contar <strong>de</strong> 1990, el <strong>cobre</strong> electrolítico se <strong>de</strong>talla como cátodos SX-EW y cátodos electrorefinados. / Electrolytic copper shown as SX-EW and electrorefined catho<strong>de</strong>s since 1990.Fuente / Source: Comisión Chilena <strong>de</strong>l Cobre / Chilean Copper Commission.18 COCHILCO


