TABLA / TABLE 83PRODUCCIÓN MUNDIAL DE PLATA DE MINAGlobal Silver Mine Production(TM <strong>de</strong> plata fina) / (MT Silver Content)1999 2000 2001 2002 2003 2004 2005 2006 2007 2008Perú / Peru 2.231,4 2.437,7 2.571,1 2.869,6 2.920,9 3.059,8 3.193,1 3.470,7 3.493,9 3.685,9México / Mexico 2.483,4 2.482,8 2.760,0 2.749,0 2.551,0 2.531,0 2.894,2 2.969,8 3.135,4 3.241,4China 1.330,0 1.330,2 1.908,0 2.000,0 2.000,4 2.000,4 2.000,4 2.000,4 2.000,4 2.000,4Australia 1.720,0 2.060,0 1.970,0 2.077,0 1.868,0 2.183,0 2.417,0 1.727,0 1.880,0 1.926,0Chile 1.380,7 1.242,2 1.348,7 1.210,5 1.312,8 1.360,1 1.399,5 1.607,2 1.936,5 1.405,0Polonia / Poland 1.092,6 1.163,6 1.230,7 1.342,0 1.332,2 1.330,0 1.262,4 1.265,1 1.240,0 1.216,2Estados Unidos / USA 1.952,0 2.017,0 1.740,0 1.350,0 1.240,0 1.250,0 1.230,0 1.138,5 1.260,0 1.207,5Bolivia 422,5 433,6 409,7 450,0 465,0 407,0 420,0 473,0 525,0 1.069,1Canadá / Canada 1.246,4 1.212,4 1.320,0 1.407,6 1.309,3 1.337,5 1.123,8 995,0 860,5 727,3Kazajstán / Kazakhstan 645,6 895,1 943,0 855,6 804,6 689,8 883,2 806,1 721,8 681,8Rusia / Russia 380,0 400,0 400,0 400,0 400,0 400,0 400,0 400,0 400,0 400,0Suecia / Swe<strong>de</strong>n 341,6 328,7 306,0 320,8 340,7 319,6 309,9 292,3 323,2 291,5Marruecos / Morocco 270,0 289,6 240,0 276,8 200,4 196,0 210,0 245,7 246,0 246,0Argentina 73,8 78,3 152,8 125,9 133,9 172,0 263,8 245,1 255,6 237,6Indonesia 292,3 334,6 348,3 288,8 376,8 376,8 282,6 182,3 204,6 201,2Uzbekistán / Uzbekistan 150,0 150,0 150,0 150,0 150,0 150,0 150,0 150,0 150,0 150,0Brasil / Brazil 130,0 130,0 130,0 130,0 130,0 130,0 130,0 130,0 130,0 130,0Guatemala - - - - - - 7,1 49,7 88,3 99,9India 53,7 40,5 49,5 52,1 51,2 14,5 31,5 30,9 82,3 96,0Sudáfrica / South Africa 152,0 144,3 112,3 110,7 87,4 70,9 87,9 87,0 70,1 71,4Bulgaria 58,7 54,5 56,8 60,0 60,0 60,0 60,0 60,0 60,0 60,0Honduras 46,5 52,6 46,8 52,9 51,0 48,2 53,6 55,0 53,9 58,9Papúa Nueva Guinea / Papua New Guinea 65,6 73,2 75,6 63,9 61,9 53,8 51,3 51,3 51,3 51,3Finlandia / Finland 31,5 23,6 22,8 29,9 34,0 49,4 47,5 50,8 50,9 50,9Corea <strong>de</strong>l Norte / North Korea 50,0 50,0 50,0 50,0 50,0 50,0 50,0 50,0 50,0 50,0Greece 39,9 30,6 61,5 74,8 7,0 - 2,3 24,7 38,3 35,5República Dem. Congo / Dem. Republic Congo - - - 2,1 35,5 31,9 53,6 67,6 76,2 34,7OTROS / Other 513,1 643,6 569,4 474,8 500,1 486,6 494,9 439,6 406,2 383,7TOTAL 17.153,5 18.098,6 18.973,2 18.974,7 18.474,1 18.758,3 19.509,6 19.064,8 19.790,3 19.809,2PARTICIPACIÓN EN LA PRODUCCIÓN MUNDIALShare of Global Production(%)1999 2000 2001 2002 2003 2004 2005 2006 2007 2008Perú / Peru 13,0 13,5 13,6 15,1 15,8 16,3 16,4 18,2 17,7 18,6México / Mexico 14,5 13,7 14,5 14,5 13,8 13,5 14,8 15,6 15,8 16,4China 7,8 7,4 10,1 10,5 10,8 10,7 10,3 10,5 10,1 10,1Australia 10,0 11,4 10,4 10,9 10,1 11,6 12,4 9,1 9,5 9,7Chile 8,0 6,9 7,1 6,4 7,1 7,3 7,2 8,4 9,8 7,1Polonia / Poland 6,4 6,4 6,5 7,1 7,2 7,1 6,5 6,6 6,3 6,1Estados Unidos / USA 11,4 11,1 9,2 7,1 6,7 6,7 6,3 6,0 6,4 6,1Bolivia 2,5 2,4 2,2 2,4 2,5 2,2 2,2 2,5 2,7 5,4Canadá / Canada 7,3 6,7 7,0 7,4 7,1 7,1 5,8 5,2 4,3 3,7Kazajstán / Kazakhstan 3,8 4,9 5,0 4,5 4,4 3,7 4,5 4,2 3,6 3,4Rusia / Russia 2,2 2,2 2,1 2,1 2,2 2,1 2,1 2,1 2,0 2,0Suecia / Swe<strong>de</strong>n 2,0 1,8 1,6 1,7 1,8 1,7 1,6 1,5 1,6 1,5Marruecos / Morocco 1,6 1,6 1,3 1,5 1,1 1,0 1,1 1,3 1,2 1,2Argentina 0,4 0,4 0,8 0,7 0,7 0,9 1,4 1,3 1,3 1,2Indonesia 1,7 1,8 1,8 1,5 2,0 2,0 1,4 1,0 1,0 1,0Uzbekistán / Uzbekistan 0,9 0,8 0,8 0,8 0,8 0,8 0,8 0,8 0,8 0,8Brasil / Brazil 0,8 0,7 0,7 0,7 0,7 0,7 0,7 0,7 0,7 0,7Guatemala - - - - - - 0,0 0,3 0,4 0,5India 0,3 0,2 0,3 0,3 0,3 0,1 0,2 0,2 0,4 0,5Sudáfrica / South Africa 0,9 0,8 0,6 0,6 0,5 0,4 0,5 0,5 0,4 0,4Bulgaria 0,3 0,3 0,3 0,3 0,3 0,3 0,3 0,3 0,3 0,3Honduras 0,3 0,3 0,2 0,3 0,3 0,3 0,3 0,3 0,3 0,3Papúa Nueva Guinea / Papua New Guinea 0,4 0,4 0,4 0,3 0,3 0,3 0,3 0,3 0,3 0,3Finlandia / Finland 0,2 0,1 0,1 0,2 0,2 0,3 0,2 0,3 0,3 0,3Corea <strong>de</strong>l Norte / North Korea 0,3 0,3 0,3 0,3 0,3 0,3 0,3 0,3 0,3 0,3Greece 0,2 0,2 0,3 0,4 0,0 - 0,0 0,1 0,2 0,2República Dem. Congo / Dem. Republic Congo - - - 0,0 0,2 0,2 0,3 0,4 0,4 0,2OTROS / Other 3,0 3,6 3,0 2,5 2,7 2,6 2,5 2,3 2,1 1,9TOTAL 100,0 100,0 100,0 100,0 100,0 100,0 100,0 100,0 100,0 100,0Fuente / Source: -World Metal Statistics March 2009 and Yearbook 2008.-Comisión Chilena <strong>de</strong>l Cobre: Cifras <strong>de</strong> Producción <strong>de</strong> Chile / Chile data: Chilean Copper Commission.142 COCHILCO
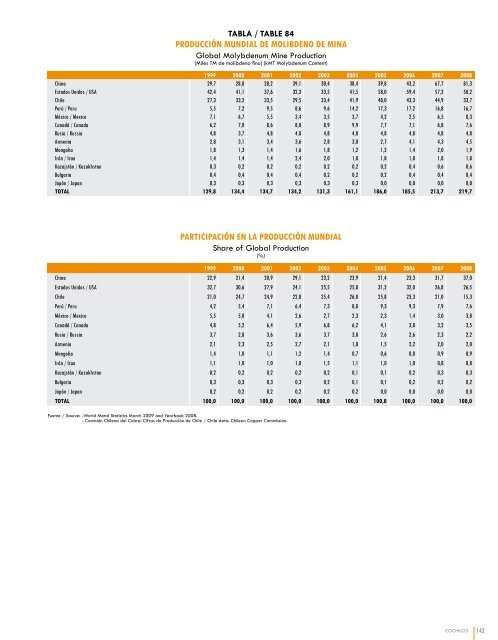
TABLA / TABLE 84PRODUCCIÓN MUNDIAL DE MOLIBDENO DE MINAGlobal Molyb<strong>de</strong>num Mine Production(Miles TM <strong>de</strong> molib<strong>de</strong>no fino) (kMT Molyb<strong>de</strong>num Content)1999 2000 2001 2002 2003 2004 2005 2006 2007 2008China 29,7 28,8 28,2 39,1 30,4 38,4 39,8 43,2 67,7 81,3Estados Unidos / USA 42,4 41,1 37,6 32,3 33,5 41,5 58,0 59,4 57,2 58,2Chile 27,3 33,2 33,5 29,5 33,4 41,9 48,0 43,3 44,9 33,7Perú / Peru 5,5 7,2 9,5 8,6 9,6 14,2 17,3 17,2 16,8 16,7México / Mexico 7,1 6,7 5,5 3,4 3,5 3,7 4,2 2,5 6,5 8,3Canadá / Canada 6,2 7,0 8,6 8,0 8,9 9,9 7,7 7,1 6,8 7,6Rusia / Russia 4,8 3,7 4,8 4,8 4,8 4,8 4,8 4,8 4,8 4,8Armenia 2,8 3,1 3,4 3,6 2,8 3,0 2,7 4,1 4,3 4,5Mongolia 1,8 1,3 1,4 1,6 1,8 1,2 1,2 1,4 2,0 1,9Irán / Iran 1,4 1,4 1,4 2,4 2,0 1,8 1,8 1,8 1,8 1,8Kazajstán / Kazakhstan 0,3 0,2 0,2 0,2 0,2 0,2 0,2 0,4 0,6 0,6Bulgaria 0,4 0,4 0,4 0,4 0,2 0,2 0,2 0,4 0,4 0,4Japón / Japan 0,3 0,3 0,3 0,3 0,3 0,3 0,0 0,0 0,0 0,0TOTAL 129,8 134,4 134,7 134,2 131,3 161,1 186,0 185,5 213,7 219,7PARTICIPACIÓN EN LA PRODUCCIÓN MUNDIALShare of Global Production(%)1999 2000 2001 2002 2003 2004 2005 2006 2007 2008China 22,9 21,4 20,9 29,1 23,2 23,9 21,4 23,3 31,7 37,0Estados Unidos / USA 32,7 30,6 27,9 24,1 25,5 25,8 31,2 32,0 26,8 26,5Chile 21,0 24,7 24,9 22,0 25,4 26,0 25,8 23,3 21,0 15,3Perú / Peru 4,2 5,4 7,1 6,4 7,3 8,8 9,3 9,3 7,9 7,6México / Mexico 5,5 5,0 4,1 2,6 2,7 2,3 2,3 1,4 3,0 3,8Canadá / Canada 4,8 5,2 6,4 5,9 6,8 6,2 4,1 3,8 3,2 3,5Rusia / Russia 3,7 2,8 3,6 3,6 3,7 3,0 2,6 2,6 2,3 2,2Armenia 2,1 2,3 2,5 2,7 2,1 1,8 1,5 2,2 2,0 2,0Mongolia 1,4 1,0 1,1 1,2 1,4 0,7 0,6 0,8 0,9 0,9Irán / Iran 1,1 1,0 1,0 1,8 1,5 1,1 1,0 1,0 0,8 0,8Kazajstán / Kazakhstan 0,2 0,2 0,2 0,2 0,2 0,1 0,1 0,2 0,3 0,3Bulgaria 0,3 0,3 0,3 0,3 0,2 0,1 0,1 0,2 0,2 0,2Japón / Japan 0,2 0,2 0,2 0,2 0,2 0,2 0,0 0,0 0,0 0,0TOTAL 100,0 100,0 100,0 100,0 100,0 100,0 100,0 100,0 100,0 100,0Fuente / Source: -World Metal Statistics March 2009 and Yearbook 2008.- Comisión Chilena <strong>de</strong>l Cobre: Cifras <strong>de</strong> Producción <strong>de</strong> Chile / Chile data: Chilean Copper Commission.COCHILCO143