- Page 2 and 3:
PUBLICA DEL PERUA NACIONAL DE EVALU
- Page 4 and 5:
PERSONAL DE ONEUN QUE HA 8NTEIWÍN8
- Page 6 and 7:
INVITA RIO . 'EVALUACIÓN E Yü T E
- Page 8 and 9:
- Ill -Página2. Recomendaciones 77
- Page 10 and 11:
- v -Página2. Conclusiones referen
- Page 12 and 13:
II -Ministerio de Agricultura y Ali
- Page 14 and 15:
pá g- n ZONA ESPERANZA-CHANDLES -Y
- Page 16 and 17:
Pág. IVZONA ESPERANZA- CHA NDLES "
- Page 18:
Pág. VIZONA ESPERANZA-CHANDLES - Y
- Page 21 and 22:
RESUMENPág. IXCon respecto a la te
- Page 23 and 24:
RESUMENPág. XIes necesario raciona
- Page 25 and 26:
Pág. 2ZONA ESPERANZA -CHA ND LES-T
- Page 27 and 28:
Pág. 4 ZONA ESPERANZA-CHANDLES-YAC
- Page 29 and 30:
CARTOGRAFÍA Pág. 7CAPITULOIICARTO
- Page 31 and 32:
LEYENDAImágenes de Radar de VXsta
- Page 33 and 34:
Pág^.m ZONA ESPERANZA-CHANDLES*YAC
- Page 35 and 36:
Pág. 12ZONA ESPERANZA -CHAÑÓLES-
- Page 37 and 38:
Pág. 14ZONA ESPERANZA -CH A NDfcE'
- Page 39 and 40:
Pág. 16 ZONA ESPERANZA-CHANDLES-YA
- Page 41 and 42:
ILUSTRACIÓN N 0 2.- Imagen LANDSAT
- Page 43 and 44:
Pág. 18 ZONA ESPERANZA-CHANDLES'YA
- Page 45 and 46:
Pág. ¿o - .ZONA ESPERANZA - CHAND
- Page 47 and 48:
CARACTERÍSTICAS GENERALES Píg. 21
- Page 49 and 50:
CARACTERÍSTICAS GENERALES Pág, 23
- Page 51 and 52:
CARACTERÍSTICAS GENERALES Pág- 2S
- Page 53 and 54:
CARACTERÍSTICAS GENERALES Pág. 27
- Page 55 and 56:
**CARACTERÍSTICAS GENERALES Pág 2
- Page 57 and 58:
CARACTERÍSTICAS GENERALES Pág. 31
- Page 59 and 60:
CARACTERÍSTICAS GENERALES Pág. 33
- Page 61 and 62:
Pág. 36 ZONA ESPERANZA-CHANDLES-YA
- Page 63 and 64:
Pág. 38 ZONA ESPERAftZA-CHANDLES-Y
- Page 65 and 66:
ZONA ESPERANZA-CHANDLES- YACOmenor
- Page 67:
FISIOGRAFÍA Pág. 4115 y 20 metros
- Page 71 and 72:
ECOLOGÍA Pág. .45CAPITULOVE C O L
- Page 73 and 74:
ECOLOGÍA Pág. 47entre 1964 y 1973
- Page 75 and 76:
ECOLOGÍA Pág. 49REGIMEN DE DISTRI
- Page 77 and 78:
ECOLOGÍA* pág. 51CUADRO N° 2-ERE
- Page 79 and 80:
C UADRO N" 4-Eot-^i-PROMEDIO DE DÍ
- Page 81 and 82:
DIAGRAMABIOCLIMATICO PARA\L^ CLASIF
- Page 83 and 84:
ECOLOGÍA Pág. 57la precipitación
- Page 85 and 86:
nCUADRO N" 6-E O_ — — j.,UNIDAD
- Page 87 and 88:
ECOLOGÍA Pao. 61CUADRO N 0 8-ELEY
- Page 89 and 90:
.CC LOGIAPág. CSDebido « la falta
- Page 91 and 92:
ECOLOGÍAMg.6 5En cuanto a las cara
- Page 93 and 94:
ECOLOGÍA Pig- 67f. Los rfos y lagu
- Page 95 and 96:
Pág. TOZONA ESPERANZA - CHANDLES"
- Page 97 and 98:
(SEOLOGtA , p á g 71" I.a. Terciar
- Page 99 and 100:
GEOLOGÍA Pag. 73También se encuen
- Page 101 and 102:
GEOLOGÍA Pág. 75b. Minerales No-M
- Page 103 and 104: GEOLOGÍAPag. 77radora de petróleo
- Page 105 and 106: su 1 : LOS p: -. 7CAPITULO VilSUELO
- Page 107 and 108: SUELOS Pág. 81(4) Un Mapa Flsiogr
- Page 109 and 110: ¿UELOSMR.píeados son los siguient
- Page 111 and 112: SUELOS Pág. 85liminación de esta
- Page 113 and 114: SUELOS Pág. 87complementados con s
- Page 115 and 116: SUC LOS Pag- f?(b) Debe tener por l
- Page 117 and 118: SUELOS Pág. 91CUADRO N 0 1-SEQUIVA
- Page 119 and 120: SUELOS Pág. 93distribuida en las
- Page 121 and 122: SUELOSPágCUADRO N 0 4-SCLASIFICACI
- Page 123 and 124: CUADRO N 0 6-SCARACTERÍSTICAS GENE
- Page 125 and 126: s Pág. 99sionadas o cóncavas en l
- Page 127 and 128: FOTO N 0 1Vista correspondiente a l
- Page 129 and 130: LOS Pág. 101Subyoce una sucesión
- Page 131 and 132: OSPag.103la acción dinámica del a
- Page 133 and 134: OS Pág. 105granulos o bloques suba
- Page 135 and 136: FOTO N°5Vista panorámica de una z
- Page 137 and 138: SUSLOS Pág. 107ciones más signifi
- Page 139 and 140: SUELOS Pág. 109tura, profundidad e
- Page 141 and 142: SUELOSPág. IllCUADRO N 0 7-SSUPERF
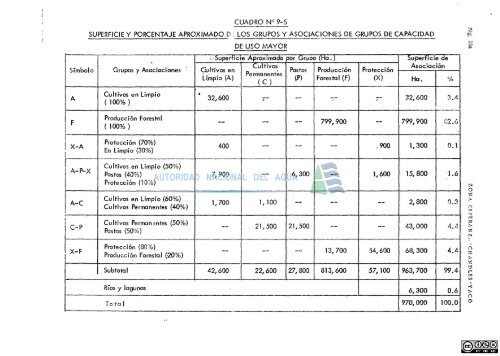
- Page 143 and 144: •CUADRO N 0 8-SSUPERFICIE Y PORCE
- Page 145 and 146: SUELOSPág.115o. Problemas de Manej
- Page 147 and 148: Pág. 117GrupoEdóficoSan Bernardo1
- Page 149 and 150: SUELOS Pág. 119a. Suelos Incluidos
- Page 151 and 152: SUELOS Pág. 121Grupo EctóficoEspe
- Page 153: SUELOS Pág. 123Protección.c. Asoc
- Page 157 and 158: SUELOS Pág. 127tuida casi en sD to
- Page 159 and 160: SUELOS Pág. 129vos, cultivos de co
- Page 161 and 162: Pág. 132ZONA ESPERANZA-CHAÑÓLES-
- Page 163 and 164: Pág. 1S4ZONA ESPERANZA-CHANDLES-YA
- Page 165 and 166: pág.iaeZONA ESPERANZA-CHANDLES-YAC
- Page 167 and 168: 138 ZONA ESPERANZA-CHANDLES-YACOEl
- Page 169 and 170: • • •J! ftí': * ! •Hermosa
- Page 171 and 172: ^ZONA ESPERANZA - CHA NDLES "YACO-S
- Page 173 and 174: ZONAESPERANZA-CHJINDLIS-YACOfolio (
- Page 175 and 176: 144 ZONA ESPERANZA-CHANDLES-YACOiDe
- Page 177 and 178: 146 ZONA ESPERANZA-CHAÑÓLES- YACO
- Page 179 and 180: CUADRON" 1 - FooVALORESESTADÍSTICO
- Page 181 and 182: CUADRO N° 3-rCONIENIDO VOLUMEIRICO
- Page 183 and 184: CUADRO N° 5-FNUMERO DE ARBOLES POR
- Page 185 and 186: Pág, 154 ZONA ESPERANZA-CHANDLES-Y
- Page 187 and 188: Pág. 156 ZONA ESPERANZA-CHANDLES-Y
- Page 189 and 190: p ág l5 g ZONA ESPERANZA-CHANDLES-
- Page 191 and 192: FORESTALES Pág. 161Purús asi* com
- Page 193 and 194: FORESTALES Pág. 163"cedro"y la "ca
- Page 195 and 196: FORESTALESP4g. J65portar el materia
- Page 197 and 198: FORESTALES Pág. 1672. Recomendacio
- Page 199 and 200: TRANSPORTES Pág. 169CAPITULOIXTRAN
- Page 201 and 202: TRANSPORTES Pág. 171Para lograr el
- Page 203 and 204: TRANSPORTES Pág. 173primera fase d
- Page 205 and 206:
TRANSPORTESrMg. 175perficie de roda
- Page 207 and 208:
TRANSPORTES Pág. 177a la vez que e
- Page 209 and 210:
TRANSPORTESPág. It?Entre los Km. 5
- Page 211 and 212:
TRANSPORTES Pág. 181movilización
- Page 213 and 214:
TRANSPORTES Pág. 183de alguna form
- Page 215 and 216:
TRANSPORTES Pág. 185de operación
- Page 217 and 218:
DIAGNOSTICO A G RO P$$ffJ A RIO Pá
- Page 219 and 220:
DIAGNOSTICO AGROPECUARIO Pág. 189C
- Page 221 and 222:
DIAGNOSTICO AGROPECUARIO Pág.' 191
- Page 223 and 224:
DIAGNOSTICO AGROPECUARIO Pág. 193A
- Page 225 and 226:
DIAGNOSTICO AGROPECUARIO Pág. 195e
- Page 227 and 228:
DIAGNOSTICO AGROPECUARIO ' P4g. 197
- Page 229 and 230:
DIAGNOSTICO AGROPECUARIO Pág. 199s
- Page 231 and 232:
DIAGNOSTICO AGROPECUARIO Pág. 201(
- Page 233 and 234:
DIAGNOSTICO AGROPECUARIO Pág. 203d
- Page 235 and 236:
DIAGNOSTICO AGROPECUARIO^g-205CUADR
- Page 237 and 238:
DIAGNOSTICO AGROPECUARIO Pag. 207ti
- Page 239 and 240:
DIAGNOSTICO AGROPECUARIO Pág. 209n
- Page 241 and 242:
DIAGNOSTICO AGROPECUARIO • Pág.
- Page 243 and 244:
DIAGNOSTICO AGROPECUARIO Pag. 213ru
- Page 245 and 246:
DIAGNOSTICO AGROPECUARIO í>ág. 21
- Page 247 and 248:
DIAGNOSTICO AGROPECUARIO Pág. 217p
- Page 249 and 250:
Pág. 220ZONA ESPERANZA "C HA ND LE
- Page 251 and 252:
Pág. 222ZONA ESPERANZA -CHAÑÓLES
- Page 253 and 254:
Pág. 224ZONA ESPERANZA " C H A ND
- Page 255 and 256:
Pá 8' 23* ZONA ESPERANZA "CHAÑÓL
- Page 257 and 258:
Pág. 228ZONA ESPERANZA-CHANDLES- Y
- Page 259 and 260:
ANEXOS
- Page 261 and 262:
CUADRO N 0 1INFORMACIÓN METEOROLÓ
- Page 263 and 264:
Pág. 4ZONA.ÍJSEERANZA^CHANnLES- Y
- Page 265 and 266:
Pág. 6ZONA ESPERANZA "CHA NDLES f.
- Page 267 and 268:
Pág. 8 „ ZQNA ESPERANZií-CflAND
- Page 269 and 270:
Pág. 10izous £sirrRAK"Z'A -'cH-Á
- Page 271 and 272:
Pág. 12 TOBA ESPER7\M T ZA-CHA.NDL
- Page 273 and 274:
Pág. 14 ZONA ESPERANZA-CHANDLES-YA
- Page 275 and 276:
••o-tcoMa
- Page 277 and 278:
Pág. 18 ZONA ESPERANZA -.CHANDLES
- Page 279 and 280:
Pág. 20ZONA ESPERANZA - CHANDLES -
- Page 281 and 282:
Mg. 22ZONA ESPERANZA - CHANDLES •
- Page 283 and 284:
• -CUADRO N* 5CONTENIDO VOLUMÉTR
- Page 285 and 286:
( ... Continuación)DETALLESUPERFIC
- Page 287 and 288:
É- 1 "OFICIA NAG GNAL DE EVALUARON
- Page 289 and 290:
EM-^ÉJÓ^ES. METÉOHOLOGICASEstcie
- Page 291 and 292:
'71 tí 00 1 :jM"; ; i€.W7¿PERTl
- Page 293 and 294:
•OFICINA NACIONAL DE EVALUACIÓN
- Page 295 and 296:
CoprtaldeDistn'oPobladoOESPERANZA,C
- Page 297 and 298:
REPUflLtCA ML PESUOFICINI NACIOIM.
- Page 299 and 300:
ESPECIES .QUE TIPIFICANLAS UNIDADES
- Page 302:
BURSASATÚRALE