Rapport de synthèse - IPCC
Rapport de synthèse - IPCC
Rapport de synthèse - IPCC

You also want an ePaper? Increase the reach of your titles
YUMPU automatically turns print PDFs into web optimized ePapers that Google loves.
<strong>Rapport</strong> <strong>de</strong> <strong>synthèse</strong><br />
Question 6<br />
Emissions, concentrations, et variations <strong>de</strong> température correspondant<br />
à divers niveaux <strong>de</strong> stabilisation pour les concentrations <strong>de</strong> CO 2<br />
(a) Emissions <strong>de</strong> CO 2 (Gt C)<br />
20<br />
18<br />
16<br />
14<br />
12<br />
10<br />
8<br />
6<br />
4<br />
2<br />
A2<br />
A1B<br />
B1<br />
0<br />
2000 2050 2100<br />
2150<br />
2200<br />
2250<br />
2300<br />
(b) Concentration CO 2 (ppm)<br />
1,100<br />
1,000<br />
900<br />
800<br />
700<br />
600<br />
500<br />
400<br />
A2<br />
A1B<br />
B1<br />
300<br />
2000 2050 2100<br />
2150<br />
2200<br />
2250<br />
2300<br />
(c) Variation <strong>de</strong> température moyenne mondiale (°C)<br />
7<br />
6<br />
5<br />
4<br />
3<br />
2<br />
A2<br />
A1B<br />
B1<br />
Profils WRE<br />
WRE 1000<br />
WRE 750<br />
WRE 650<br />
WRE 550<br />
WRE 450<br />
Profils S<br />
1<br />
Scénarios RSSE<br />
0<br />
2000 2050 2100<br />
2150<br />
2200<br />
2250<br />
2300<br />
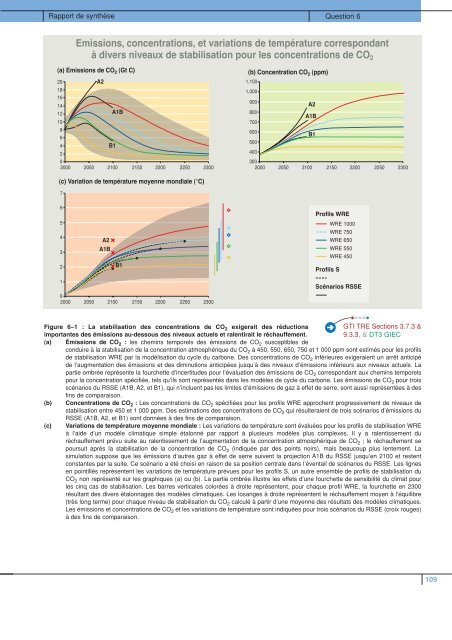
Figure 6–1 : La stabilisation <strong>de</strong>s concentrations <strong>de</strong> CO 2 exigerait <strong>de</strong>s réductions<br />
GTI TRE Sections 3.7.3 &<br />
importantes <strong>de</strong>s émissions au-<strong>de</strong>ssous <strong>de</strong>s niveaux actuels et ralentirait le réchauffement.<br />
9.3.3, & DT3 GIEC<br />
(a) Émissions <strong>de</strong> CO 2 : les chemins temporels <strong>de</strong>s émissions <strong>de</strong> CO 2 susceptibles <strong>de</strong><br />
conduire à la stabilisation <strong>de</strong> la concentration atmosphérique du CO 2 à 450, 550, 650, 750 et 1 000 ppm sont estimés pour les profils<br />
<strong>de</strong> stabilisation WRE par la modélisation du cycle du carbone. Des concentrations <strong>de</strong> CO 2 inférieures exigeraient un arrêt anticipé<br />
<strong>de</strong> l’augmentation <strong>de</strong>s émissions et <strong>de</strong>s diminutions anticipées jusqu’à <strong>de</strong>s niveaux d’émissions inférieurs aux niveaux actuels. La<br />
partie ombrée représente la fourchette d’incertitu<strong>de</strong>s pour l’évaluation <strong>de</strong>s émissions <strong>de</strong> CO 2 correspondant aux chemins temporels<br />
pour la concentration spécifiée, tels qu’ils sont représentés dans les modèles <strong>de</strong> cycle du carbone. Les émissions <strong>de</strong> CO 2 pour trois<br />
scénarios du RSSE (A1B, A2, et B1), qui n’incluent pas les limites d’émissions <strong>de</strong> gaz à effet <strong>de</strong> serre, sont aussi représentées à <strong>de</strong>s<br />
fins <strong>de</strong> comparaison.<br />
(b) Concentrations <strong>de</strong> CO 2 : Les concentrations <strong>de</strong> CO 2 spécifiées pour les profils WRE approchent progressivement <strong>de</strong> niveaux <strong>de</strong><br />
stabilisation entre 450 et 1 000 ppm. Des estimations <strong>de</strong>s concentrations <strong>de</strong> CO 2 qui résulteraient <strong>de</strong> trois scénarios d’émissions du<br />
RSSE (A1B, A2, et B1) sont données à <strong>de</strong>s fins <strong>de</strong> comparaison.<br />
(c) Variations <strong>de</strong> température moyenne mondiale : Les variations <strong>de</strong> température sont évaluées pour les profils <strong>de</strong> stabilisation WRE<br />
à l’ai<strong>de</strong> d’un modèle climatique simple étalonné par rapport à plusieurs modèles plus complexes. Il y a ralentissement du<br />
réchauffement prévu suite au ralentissement <strong>de</strong> l’augmentation <strong>de</strong> la concentration atmosphérique <strong>de</strong> CO 2 ; le réchauffement se<br />
poursuit après la stabilisation <strong>de</strong> la concentration <strong>de</strong> CO 2 (indiquée par <strong>de</strong>s points noirs), mais beaucoup plus lentement. La<br />
simulation suppose que les émissions d’autres gaz à effet <strong>de</strong> serre suivent la projection A1B du RSSE jusqu’en 2100 et restent<br />
constantes par la suite. Ce scénario a été choisi en raison <strong>de</strong> sa position centrale dans l’éventail <strong>de</strong> scénarios du RSSE. Les lignes<br />
en pointillés représentent les variations <strong>de</strong> température prévues pour les profils S, un autre ensemble <strong>de</strong> profils <strong>de</strong> stabilisation du<br />
CO 2 non représenté sur les graphiques (a) ou (b). La partie ombrée illustre les effets d’une fourchette <strong>de</strong> sensibilité du climat pour<br />
les cinq cas <strong>de</strong> stabilisation. Les barres verticales colorées à droite représentent, pour chaque profil WRE, la fourchette en 2300<br />
résultant <strong>de</strong>s divers étalonnages <strong>de</strong>s modèles climatiques. Les losanges à droite représentent le réchauffement moyen à l’équilibre<br />
(très long terme) pour chaque niveau <strong>de</strong> stabilisation du CO 2 calculé à partir d’une moyenne <strong>de</strong>s résultats <strong>de</strong>s modèles climatiques.<br />
Les émissions et concentrations <strong>de</strong> CO 2 et les variations <strong>de</strong> température sont indiquées pour trois scénarios du RSSE (croix rouges)<br />
à <strong>de</strong>s fins <strong>de</strong> comparaison.<br />
109