Jaaroverzicht Vlaamse havens 2007 - VNSC Communicatie
Jaaroverzicht Vlaamse havens 2007 - VNSC Communicatie
Jaaroverzicht Vlaamse havens 2007 - VNSC Communicatie

You also want an ePaper? Increase the reach of your titles
YUMPU automatically turns print PDFs into web optimized ePapers that Google loves.
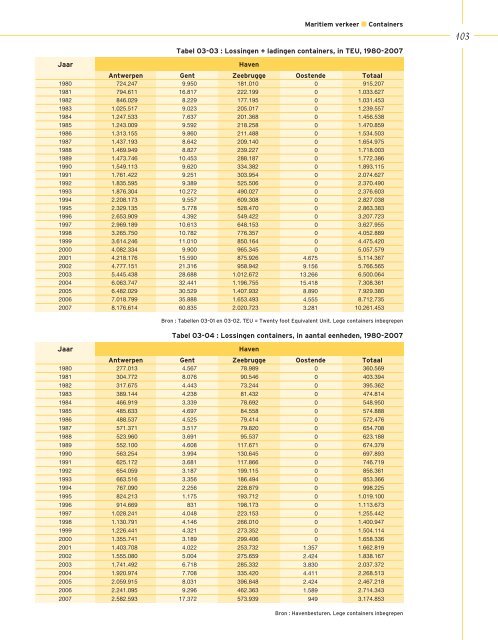
Jaar Haven<br />
Maritiem verkeer n Containers<br />
Antwerpen Gent Zeebrugge Oostende Totaal<br />
1980 724.247 9.950 181.010 0 915.207<br />
1981 794.611 16.817 222.199 0 1.033.627<br />
1982 846.029 8.229 177.195 0 1.031.453<br />
1983 1.025.517 9.023 205.017 0 1.239.557<br />
1984 1.247.533 7.637 201.368 0 1.456.538<br />
1985 1.243.009 9.592 218.258 0 1.470.859<br />
1986 1.313.155 9.860 211.488 0 1.534.503<br />
1987 1.437.193 8.642 209.140 0 1.654.975<br />
1988 1.469.949 8.827 239.227 0 1.718.003<br />
1989 1.473.746 10.453 288.187 0 1.772.386<br />
1990 1.549.113 9.620 334.382 0 1.893.115<br />
1991 1.761.422 9.251 303.954 0 2.074.627<br />
1992 1.835.595 9.389 525.506 0 2.370.490<br />
1993 1.876.304 10.272 490.027 0 2.376.603<br />
1994 2.208.173 9.557 609.308 0 2.827.038<br />
1995 2.329.135 5.778 528.470 0 2.863.383<br />
1996 2.653.909 4.392 549.422 0 3.207.723<br />
1997 2.969.189 10.613 648.153 0 3.627.955<br />
1998 3.265.750 10.782 776.357 0 4.052.889<br />
1999 3.614.246 11.010 850.164 0 4.475.420<br />
2000 4.082.334 9.900 965.345 0 5.057.579<br />
2001 4.218.176 15.590 875.926 4.675 5.114.367<br />
2002 4.777.151 21.316 958.942 9.156 5.766.565<br />
2003 5.445.438 28.688 1.012.672 13.266 6.500.064<br />
2004 6.063.747 32.441 1.196.755 15.418 7.308.361<br />
2005 6.482.029 30.529 1.407.932 8.890 7.929.380<br />
2006 7.018.799 35.888 1.653.493 4.555 8.712.735<br />
<strong>2007</strong> 8.176.614 60.835 2.020.723 3.281 10.261.453<br />
Jaar Haven<br />
Tabel 03-03 : Lossingen + ladingen containers, in TEU, 1980-<strong>2007</strong><br />
Bron : Tabellen 03-01 en 03-02. TEU = Twenty foot Equivalent Unit. Lege containers inbegrepen<br />
Tabel 03-04 : Lossingen containers, in aantal eenheden, 1980-<strong>2007</strong><br />
Antwerpen Gent Zeebrugge Oostende Totaal<br />
1980 277.013 4.567 78.989 0 360.569<br />
1981 304.772 8.076 90.546 0 403.394<br />
1982 317.675 4.443 73.244 0 395.362<br />
1983 389.144 4.238 81.432 0 474.814<br />
1984 466.919 3.339 78.692 0 548.950<br />
1985 485.633 4.697 84.558 0 574.888<br />
1986 488.537 4.525 79.414 0 572.476<br />
1987 571.371 3.517 79.820 0 654.708<br />
1988 523.960 3.691 95.537 0 623.188<br />
1989 552.100 4.608 117.671 0 674.379<br />
1990 563.254 3.994 130.645 0 697.893<br />
1991 625.172 3.681 117.866 0 746.719<br />
1992 654.059 3.187 199.115 0 856.361<br />
1993 663.516 3.356 186.494 0 853.366<br />
1994 767.090 2.256 228.879 0 998.225<br />
1995 824.213 1.175 193.712 0 1.019.100<br />
1996 914.669 831 198.173 0 1.113.673<br />
1997 1.028.241 4.048 223.153 0 1.255.442<br />
1998 1.130.791 4.146 266.010 0 1.400.947<br />
1999 1.226.441 4.321 273.352 0 1.504.114<br />
2000 1.355.741 3.189 299.406 0 1.658.336<br />
2001 1.403.708 4.022 253.732 1.357 1.662.819<br />
2002 1.555.080 5.004 275.659 2.424 1.838.167<br />
2003 1.741.492 6.718 285.332 3.830 2.037.372<br />
2004 1.920.974 7.708 335.420 4.411 2.268.513<br />
2005 2.059.915 8.031 396.848 2.424 2.467.218<br />
2006 2.241.095 9.296 462.363 1.589 2.714.343<br />
<strong>2007</strong> 2.582.593 17.372 573.939 949 3.174.853<br />
Bron : Havenbesturen. Lege containers inbegrepen<br />
0