Jaaroverzicht Vlaamse havens 2007 - VNSC Communicatie
Jaaroverzicht Vlaamse havens 2007 - VNSC Communicatie
Jaaroverzicht Vlaamse havens 2007 - VNSC Communicatie

You also want an ePaper? Increase the reach of your titles
YUMPU automatically turns print PDFs into web optimized ePapers that Google loves.
04<br />
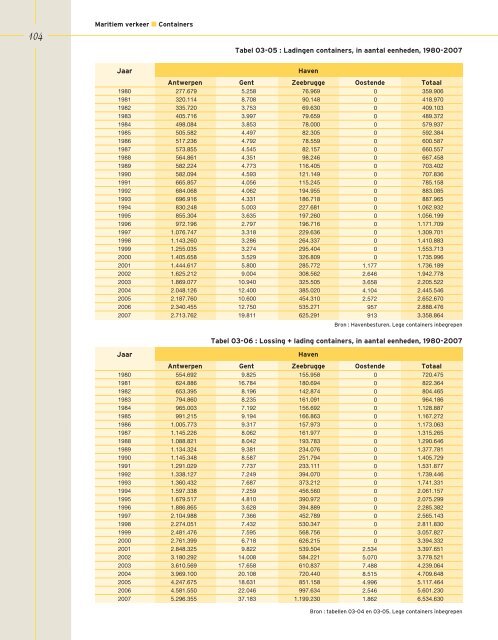
Maritiem verkeer n Containers<br />
Jaar Haven<br />
Tabel 03-05 : Ladingen containers, in aantal eenheden, 1980-<strong>2007</strong><br />
Antwerpen Gent Zeebrugge Oostende Totaal<br />
1980 277.679 5.258 76.969 0 359.906<br />
1981 320.114 8.708 90.148 0 418.970<br />
1982 335.720 3.753 69.630 0 409.103<br />
1983 405.716 3.997 79.659 0 489.372<br />
1984 498.084 3.853 78.000 0 579.937<br />
1985 505.582 4.497 82.305 0 592.384<br />
1986 517.236 4.792 78.559 0 600.587<br />
1987 573.855 4.545 82.157 0 660.557<br />
1988 564.861 4.351 98.246 0 667.458<br />
1989 582.224 4.773 116.405 0 703.402<br />
1990 582.094 4.593 121.149 0 707.836<br />
1991 665.857 4.056 115.245 0 785.158<br />
1992 684.068 4.062 194.955 0 883.085<br />
1993 696.916 4.331 186.718 0 887.965<br />
1994 830.248 5.003 227.681 0 1.062.932<br />
1995 855.304 3.635 197.260 0 1.056.199<br />
1996 972.196 2.797 196.716 0 1.171.709<br />
1997 1.076.747 3.318 229.636 0 1.309.701<br />
1998 1.143.260 3.286 264.337 0 1.410.883<br />
1999 1.255.035 3.274 295.404 0 1.553.713<br />
2000 1.405.658 3.529 326.809 0 1.735.996<br />
2001 1.444.617 5.800 285.772 1.177 1.736.189<br />
2002 1.625.212 9.004 308.562 2.646 1.942.778<br />
2003 1.869.077 10.940 325.505 3.658 2.205.522<br />
2004 2.048.126 12.400 385.020 4.104 2.445.546<br />
2005 2.187.760 10.600 454.310 2.572 2.652.670<br />
2006 2.340.455 12.750 535.271 957 2.888.476<br />
<strong>2007</strong> 2.713.762 19.811 625.291 913 3.358.864<br />
Jaar Haven<br />
Bron : Havenbesturen. Lege containers inbegrepen<br />
Tabel 03-06 : Lossing + lading containers, in aantal eenheden, 1980-<strong>2007</strong><br />
Antwerpen Gent Zeebrugge Oostende Totaal<br />
1980 554.692 9.825 155.958 0 720.475<br />
1981 624.886 16.784 180.694 0 822.364<br />
1982 653.395 8.196 142.874 0 804.465<br />
1983 794.860 8.235 161.091 0 964.186<br />
1984 965.003 7.192 156.692 0 1.128.887<br />
1985 991.215 9.194 166.863 0 1.167.272<br />
1986 1.005.773 9.317 157.973 0 1.173.063<br />
1987 1.145.226 8.062 161.977 0 1.315.265<br />
1988 1.088.821 8.042 193.783 0 1.290.646<br />
1989 1.134.324 9.381 234.076 0 1.377.781<br />
1990 1.145.348 8.587 251.794 0 1.405.729<br />
1991 1.291.029 7.737 233.111 0 1.531.877<br />
1992 1.338.127 7.249 394.070 0 1.739.446<br />
1993 1.360.432 7.687 373.212 0 1.741.331<br />
1994 1.597.338 7.259 456.560 0 2.061.157<br />
1995 1.679.517 4.810 390.972 0 2.075.299<br />
1996 1.886.865 3.628 394.889 0 2.285.382<br />
1997 2.104.988 7.366 452.789 0 2.565.143<br />
1998 2.274.051 7.432 530.347 0 2.811.830<br />
1999 2.481.476 7.595 568.756 0 3.057.827<br />
2000 2.761.399 6.718 626.215 0 3.394.332<br />
2001 2.848.325 9.822 539.504 2.534 3.397.651<br />
2002 3.180.292 14.008 584.221 5.070 3.778.521<br />
2003 3.610.569 17.658 610.837 7.488 4.239.064<br />
2004 3.969.100 20.108 720.440 8.515 4.709.648<br />
2005 4.247.675 18.631 851.158 4.996 5.117.464<br />
2006 4.581.550 22.046 997.634 2.546 5.601.230<br />
<strong>2007</strong> 5.296.355 37.183 1.199.230 1.862 6.534.630<br />
Bron : tabellen 03-04 en 03-05. Lege containers inbegrepen