Jaaroverzicht Vlaamse havens 2007 - VNSC Communicatie
Jaaroverzicht Vlaamse havens 2007 - VNSC Communicatie
Jaaroverzicht Vlaamse havens 2007 - VNSC Communicatie

Create successful ePaper yourself
Turn your PDF publications into a flip-book with our unique Google optimized e-Paper software.
Jaar<br />
Jaar<br />
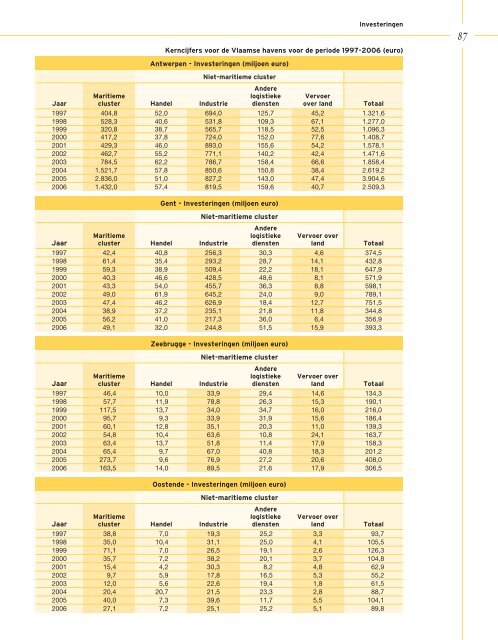
Gent - Investeringen (miljoen euro)<br />
Maritieme<br />
cluster Handel Industrie<br />
Niet-maritieme cluster<br />
Andere<br />
logistieke<br />
diensten<br />
Vervoer over<br />
land Totaal<br />
1997 42,4 40,8 256,3 30,3 4,6 374,5<br />
1998 61,4 35,4 293,2 28,7 14,1 432,8<br />
1999 59,3 38,9 509,4 22,2 18,1 647,9<br />
2000 40,3 46,6 428,5 48,6 8,1 571,9<br />
2001 43,3 54,0 455,7 36,3 8,8 598,1<br />
2002 49,0 61,9 645,2 24,0 9,0 789,1<br />
2003 47,4 46,2 626,9 18,4 12,7 751,5<br />
2004 38,9 37,2 235,1 21,8 11,8 344,8<br />
2005 56,2 41,0 217,3 36,0 6,4 356,9<br />
2006 49,1 32,0 244,8 51,5 15,9 393,3<br />
Jaar<br />
Zeebrugge - Investeringen (miljoen euro)<br />
Maritieme<br />
cluster Handel Industrie<br />
Niet-maritieme cluster<br />
Andere<br />
logistieke<br />
diensten<br />
Vervoer over<br />
land Totaal<br />
1997 46,4 10,0 33,9 29,4 14,6 134,3<br />
1998 57,7 11,9 78,8 26,3 15,3 190,1<br />
1999 117,5 13,7 34,0 34,7 16,0 216,0<br />
2000 95,7 9,3 33,9 31,9 15,6 186,4<br />
2001 60,1 12,8 35,1 20,3 11,0 139,3<br />
2002 54,8 10,4 63,6 10,8 24,1 163,7<br />
2003 63,4 13,7 51,8 11,4 17,9 158,3<br />
2004 65,4 9,7 67,0 40,8 18,3 201,2<br />
2005 273,7 9,6 76,9 27,2 20,6 408,0<br />
2006 163,5 14,0 89,5 21,6 17,9 306,5<br />
Jaar<br />
Antwerpen - Investeringen (miljoen euro)<br />
Maritieme<br />
cluster Handel Industrie<br />
Oostende - Investeringen (miljoen euro)<br />
Maritieme<br />
cluster Handel Industrie<br />
Niet-maritieme cluster<br />
Andere<br />
logistieke<br />
diensten<br />
Niet-maritieme cluster<br />
Andere<br />
logistieke<br />
diensten<br />
Investeringen<br />
Kerncijfers voor de <strong>Vlaamse</strong> <strong>havens</strong> voor de periode 1997-2006 (euro)<br />
Vervoer<br />
over land Totaal<br />
1997 404,8 52,0 694,0 125,7 45,2 1.321,6<br />
1998 528,3 40,6 531,8 109,3 67,1 1.277,0<br />
1999 320,8 38,7 565,7 118,5 52,5 1.096,3<br />
2000 417,2 37,8 724,0 152,0 77,6 1.408,7<br />
2001 429,3 46,0 893,0 155,6 54,2 1.578,1<br />
2002 462,7 55,2 771,1 140,2 42,4 1.471,6<br />
2003 784,5 62,2 786,7 158,4 66,6 1.858,4<br />
2004 1.521,7 57,8 850,6 150,8 38,4 2.619,2<br />
2005 2.836,0 51,0 827,2 143,0 47,4 3.904,6<br />
2006 1.432,0 57,4 819,5 159,6 40,7 2.509,3<br />
Vervoer over<br />
land Totaal<br />
1997 38,8 7,0 19,3 25,2 3,3 93,7<br />
1998 35,0 10,4 31,1 25,0 4,1 105,5<br />
1999 71,1 7,0 26,5 19,1 2,6 126,3<br />
2000 35,7 7,2 38,2 20,1 3,7 104,8<br />
2001 15,4 4,2 30,3 8,2 4,8 62,9<br />
2002 9,7 5,9 17,8 16,5 5,3 55,2<br />
2003 12,0 5,6 22,6 19,4 1,8 61,5<br />
2004 20,4 20,7 21,5 23,3 2,8 88,7<br />
2005 40,0 7,3 39,6 11,7 5,5 104,1<br />
2006 27,1 7,2 25,1 25,2 5,1 89,8<br />
87