Jaaroverzicht Vlaamse havens 2007 - VNSC Communicatie
Jaaroverzicht Vlaamse havens 2007 - VNSC Communicatie
Jaaroverzicht Vlaamse havens 2007 - VNSC Communicatie

Create successful ePaper yourself
Turn your PDF publications into a flip-book with our unique Google optimized e-Paper software.
82<br />
Werkgelegenheid<br />
Jaar<br />
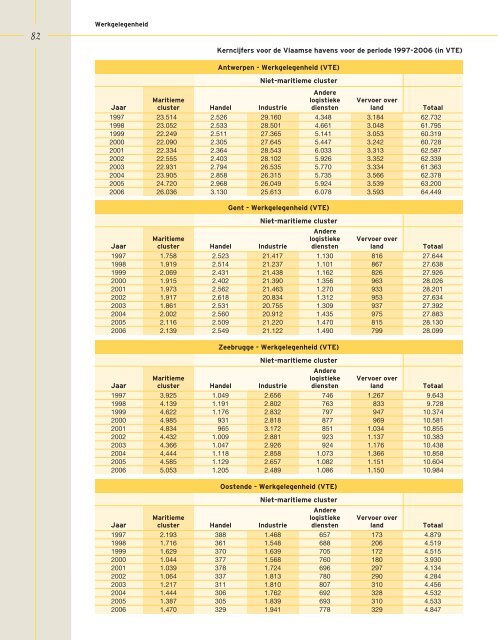
Antwerpen - Werkgelegenheid (VTE)<br />
Maritieme<br />
cluster Handel Industrie<br />
Niet-maritieme cluster<br />
Andere<br />
logistieke<br />
diensten<br />
Vervoer over<br />
land Totaal<br />
1997 23.514 2.526 29.160 4.348 3.184 62.732<br />
1998 23.052 2.533 28.501 4.661 3.048 61.795<br />
1999 22.249 2.511 27.365 5.141 3.053 60.319<br />
2000 22.090 2.305 27.645 5.447 3.242 60.728<br />
2001 22.334 2.364 28.543 6.033 3.313 62.587<br />
2002 22.555 2.403 28.102 5.926 3.352 62.339<br />
2003 22.931 2.794 26.535 5.770 3.334 61.363<br />
2004 23.905 2.858 26.315 5.735 3.566 62.378<br />
2005 24.720 2.968 26.049 5.924 3.539 63.200<br />
2006 26.036 3.130 25.613 6.078 3.593 64.449<br />
Jaar<br />
Jaar<br />
Gent - Werkgelegenheid (VTE)<br />
Maritieme<br />
cluster Handel Industrie<br />
Zeebrugge - Werkgelegenheid (VTE)<br />
Maritieme<br />
cluster Handel Industrie<br />
Niet-maritieme cluster<br />
Andere<br />
logistieke<br />
diensten<br />
Niet-maritieme cluster<br />
Andere<br />
logistieke<br />
diensten<br />
Vervoer over<br />
land Totaal<br />
1997 1.758 2.523 21.417 1.130 816 27.644<br />
1998 1.919 2.514 21.237 1.101 867 27.638<br />
1999 2.069 2.431 21.438 1.162 826 27.926<br />
2000 1.915 2.402 21.390 1.356 963 28.026<br />
2001 1.973 2.562 21.463 1.270 933 28.201<br />
2002 1.917 2.618 20.834 1.312 953 27.634<br />
2003 1.861 2.531 20.755 1.309 937 27.392<br />
2004 2.002 2.560 20.912 1.435 975 27.883<br />
2005 2.116 2.509 21.220 1.470 815 28.130<br />
2006 2.139 2.549 21.122 1.490 799 28.099<br />
Vervoer over<br />
land Totaal<br />
1997 3.925 1.049 2.656 746 1.267 9.643<br />
1998 4.139 1.191 2.802 763 833 9.728<br />
1999 4.622 1.176 2.832 797 947 10.374<br />
2000 4.985 931 2.818 877 969 10.581<br />
2001 4.834 965 3.172 851 1.034 10.855<br />
2002 4.432 1.009 2.881 923 1.137 10.383<br />
2003 4.366 1.047 2.926 924 1.176 10.438<br />
2004 4.444 1.118 2.858 1.073 1.366 10.858<br />
2005 4.585 1.129 2.657 1.082 1.151 10.604<br />
2006 5.053 1.205 2.489 1.086 1.150 10.984<br />
Jaar<br />
Kerncijfers voor de <strong>Vlaamse</strong> <strong>havens</strong> voor de periode 1997-2006 (in VTE)<br />
Oostende - Werkgelegenheid (VTE)<br />
Maritieme<br />
cluster Handel Industrie<br />
Niet-maritieme cluster<br />
Andere<br />
logistieke<br />
diensten<br />
Vervoer over<br />
land Totaal<br />
1997 2.193 388 1.468 657 173 4.879<br />
1998 1.716 361 1.548 688 206 4.519<br />
1999 1.629 370 1.639 705 172 4.515<br />
2000 1.044 377 1.568 760 180 3.930<br />
2001 1.039 378 1.724 696 297 4.134<br />
2002 1.064 337 1.813 780 290 4.284<br />
2003 1.217 311 1.810 807 310 4.456<br />
2004 1.444 306 1.762 692 328 4.532<br />
2005 1.387 305 1.839 693 310 4.533<br />
2006 1.470 329 1.941 778 329 4.847