Jaaroverzicht Vlaamse havens 2007 - VNSC Communicatie
Jaaroverzicht Vlaamse havens 2007 - VNSC Communicatie
Jaaroverzicht Vlaamse havens 2007 - VNSC Communicatie

Create successful ePaper yourself
Turn your PDF publications into a flip-book with our unique Google optimized e-Paper software.
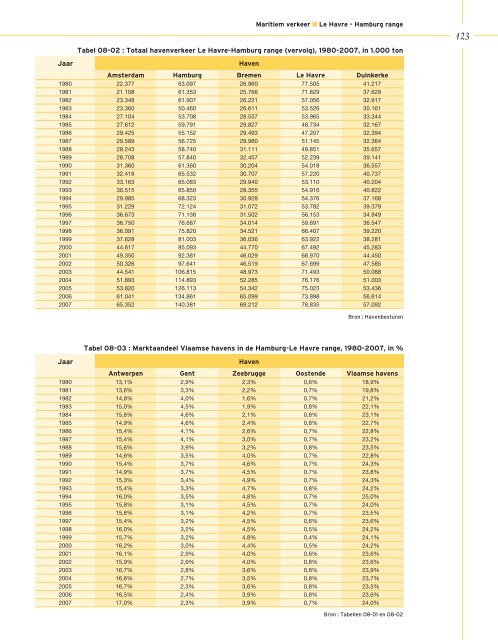
Maritiem verkeer ■ Le Havre - Hamburg range<br />
Tabel 08-02 : Totaal havenverkeer Le Havre-Hamburg range (vervolg), 1980-<strong>2007</strong>, in 1.000 ton<br />
Jaar Haven<br />
Amsterdam Hamburg Bremen Le Havre Duinkerke<br />
1980 22.377 63.097 26.960 77.505 41.217<br />
1981 21.108 61.353 25.766 71.829 37.629<br />
1982 23.348 61.907 26.221 57.056 32.917<br />
1983 23.360 50.460 26.611 53.526 30.161<br />
1984 27.104 53.708 28.557 53.965 33.344<br />
1985 27.612 59.791 29.827 48.734 32.167<br />
1986 29.425 55.152 29.493 47.207 32.394<br />
1987 29.589 56.725 29.980 51.145 32.364<br />
1988 28.243 58.740 31.111 49.851 35.657<br />
1989 28.708 57.840 32.457 52.239 39.141<br />
1990 31.360 61.360 30.204 54.018 36.557<br />
1991 32.418 65.532 30.707 57.220 40.737<br />
1992 33.163 65.083 29.940 53.110 40.204<br />
1993 30.515 65.850 28.355 54.916 40.822<br />
1994 29.985 68.323 30.928 54.376 37.168<br />
1995 31.229 72.124 31.072 53.782 39.379<br />
1996 36.673 71.138 31.502 56.153 34.949<br />
1997 36.750 76.687 34.014 59.691 36.547<br />
1998 36.091 75.820 34.521 66.407 39.220<br />
1999 37.628 81.003 36.036 63.922 38.281<br />
2000 44.617 85.093 44.770 67.492 45.283<br />
2001 49.350 92.361 46.029 68.970 44.450<br />
2002 50.326 97.641 46.519 67.699 47.585<br />
2003 44.541 106.815 48.973 71.493 50.088<br />
2004 51.893 114.893 52.285 76.176 51.003<br />
2005 53.820 126.113 54.342 75.023 53.436<br />
2006 61.041 134.861 65.099 73.898 56.614<br />
<strong>2007</strong> 65.352 140.381 69.212 78.835 57.092<br />
Bron : Havenbesturen<br />
Tabel 08-03 : Marktaandeel <strong>Vlaamse</strong> <strong>havens</strong> in de Hamburg-Le Havre range, 1980-<strong>2007</strong>, in %<br />
Jaar Haven<br />
Antwerpen Gent Zeebrugge Oostende <strong>Vlaamse</strong> <strong>havens</strong><br />
1980 13,1% 2,9% 2,3% 0,6% 18,9%<br />
1981 13,6% 3,3% 2,2% 0,7% 19,8%<br />
1982 14,8% 4,0% 1,6% 0,7% 21,2%<br />
1983 15,0% 4,5% 1,9% 0,8% 22,1%<br />
1984 15,6% 4,6% 2,1% 0,8% 23,1%<br />
1985 14,9% 4,6% 2,4% 0,8% 22,7%<br />
1986 15,4% 4,1% 2,6% 0,7% 22,8%<br />
1987 15,4% 4,1% 3,0% 0,7% 23,2%<br />
1988 15,6% 3,9% 3,2% 0,8% 23,5%<br />
1989 14,6% 3,5% 4,0% 0,7% 22,8%<br />
1990 15,4% 3,7% 4,6% 0,7% 24,3%<br />
1991 14,9% 3,7% 4,5% 0,7% 23,8%<br />
1992 15,3% 3,4% 4,9% 0,7% 24,3%<br />
1993 15,4% 3,3% 4,7% 0,8% 24,2%<br />
1994 16,0% 3,5% 4,8% 0,7% 25,0%<br />
1995 15,8% 3,1% 4,5% 0,7% 24,0%<br />
1996 15,6% 3,1% 4,2% 0,7% 23,5%<br />
1997 15,4% 3,2% 4,5% 0,6% 23,6%<br />
1998 16,0% 3,2% 4,5% 0,5% 24,2%<br />
1999 15,7% 3,2% 4,8% 0,4% 24,1%<br />
2000 16,2% 3,0% 4,4% 0,5% 24,2%<br />
2001 16,1% 2,9% 4,0% 0,6% 23,6%<br />
2002 15,9% 2,9% 4,0% 0,8% 23,6%<br />
2003 16,7% 2,8% 3,6% 0,8% 23,9%<br />
2004 16,6% 2,7% 3,5% 0,8% 23,7%<br />
2005 16,7% 2,3% 3,6% 0,8% 23,5%<br />
2006 16,5% 2,4% 3,9% 0,8% 23,6%<br />
<strong>2007</strong> 17,0% 2,3% 3,9% 0,7% 24,0%<br />
Bron : Tabellen 08-01 en 08-02<br />
2