- Page 1:
Analyse af solafskærmninger mht. t
- Page 5 and 6:
Abstract The present thesis deals w
- Page 7 and 8:
Indholdsfortegnelse FORORD ........
- Page 9:
10.2.6 Erfaringer med spørgeskemae
- Page 12 and 13:
I forbindelse med fuldskalaforsøge
- Page 14 and 15:
generende reflekser i computerskær
- Page 16 and 17:
Derudover bør solafskærmningen ku
- Page 18 and 19:
Metodeafsnit I det følgende beskri
- Page 20 and 21:
Desværre gik producenten, der skul
- Page 22 and 23:
4 Kriterier for visuel komfort Visu
- Page 24 and 25:
4.6 Opsamling I nedenstående tabel
- Page 26 and 27:
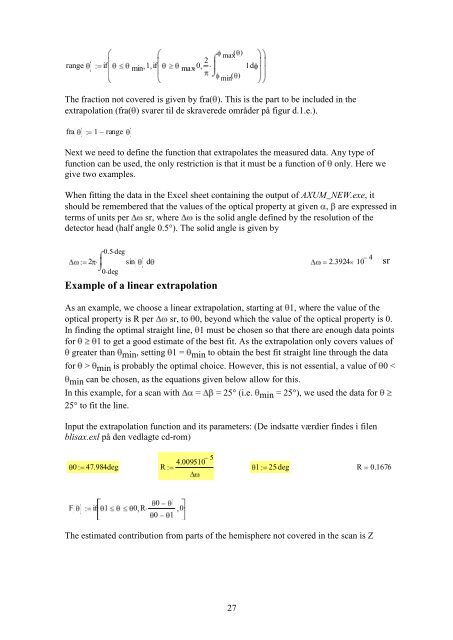
5.2.1 Den totale solenergitransmitt
- Page 28 and 29:
solafskærmningerne. For en beskriv
- Page 30 and 31:
6 Fuldskalaforsøg Hovedformålet m
- Page 32 and 33:
Desuden bemærkes, at det yderste g
- Page 34 and 35:
Vejrtype Symbol Beskrivelse I: Skyf
- Page 36 and 37:
Hovedemnerne i spørgeskemaet skull
- Page 38 and 39:
spørgsmålet om farveændring af o
- Page 40 and 41:
6.5 Forsøgspersoner For med rimeli
- Page 42 and 43:
Tid 9.15 10.15 11.00 11.45 12.30 13
- Page 44 and 45:
Efter de første to dage stod det k
- Page 46 and 47:
I analysen af resultaterne vil mål
- Page 48 and 49:
6.9.4 Parametrisk test For at kunne
- Page 50 and 51:
7 Målinger af belysningsmæssige o
- Page 52 and 53:
Dagslysfaktoren blev bestemt ved at
- Page 54 and 55:
Reduktionsfaktorerne blev bestemt f
- Page 56 and 57:
For at begrænse antallet af målin
- Page 58 and 59:
flere ruder i programmets database.
- Page 60 and 61:
himmel for lokalet med persiennen,
- Page 62 and 63:
højere end den visuelle transmitta
- Page 64 and 65:
v [-] F l [-] 1 0.8 0.6 0.4 0.2 0 L
- Page 66 and 67:
Når afskærmningerne indstilles ti
- Page 68 and 69:
dag med solskin fra en klar himmel.
- Page 70 and 71:
Termiske egenskaber I nedenstående
- Page 72 and 73:
9.6 Opsamling Screenen Screenen er
- Page 74 and 75:
10 Analyse af forsøg I det følgen
- Page 76 and 77:
se afsnit 4.1. For de øvrige tre l
- Page 78 and 79:
At filmen skærmer dårligst var ve
- Page 80 and 81:
10.2.1 Belysningsforholdene I det n
- Page 82 and 83:
elysningsniveauer ved de to indstil
- Page 84 and 85:
angiver p-værdierne, og såfremt p
- Page 86 and 87:
Forsøgspersonerne vurderer, at man
- Page 88 and 89:
I figur 10.2.f ses de solafskærmni
- Page 90 and 91:
Lokale C E D B A Middelværdi 4,3 4
- Page 92 and 93:
være længere oppe. Indstillingen
- Page 94 and 95:
Spørgsmål 2.11 Hvor tilfreds er d
- Page 96 and 97:
Sp. 2.1 Sp. 2.2 Sp. 2.7 5 4 3 Påvi
- Page 98 and 99:
hænger sammen med, at der er flest
- Page 100 and 101:
Spørgsmål 4.1.b [%] 100 80 60 40
- Page 102 and 103:
I sol med helt lukkede afskærmning
- Page 104 and 105:
anvendt et stativ fra producenten.
- Page 106 and 107:
som det i forhold til dette projekt
- Page 108 and 109:
Bagerste Midterste Forreste y [m] 2
- Page 110 and 111:
maksimal solhøjde), hvorfor vindue
- Page 112 and 113:
Figur 11.3.c Belysningsstyrker d. 2
- Page 114 and 115:
Belysningsstyrkerne varierer fra ca
- Page 116 and 117:
Når persiennen er helt lukket er d
- Page 118 and 119:
lukket. Kravet til belysningsniveau
- Page 120 and 121:
190 128 47 274 186 68 442 297 109 B
- Page 122 and 123:
Som for referencelokalet er belysni
- Page 124 and 125:
Figur 11.5.f Belysningsstyrker i lo
- Page 126 and 127:
11.6.2 Glaslameller: Halvt lukket,
- Page 128 and 129:
200 135 49 310 207 76 604 405 149 B
- Page 130 and 131:
midterste del af lokalet samt i den
- Page 132 and 133:
Behovet for afskærmning i de enkel
- Page 134 and 135:
mindre, hvorfor glaslamellerne i ov
- Page 136 and 137:
igen ved simuleringerne om dagen. P
- Page 138 and 139:
understøttes af tidligere undersø
- Page 140 and 141:
12.4 De undersøgte solafskærmning
- Page 142 and 143: forsøgspersonerne kun opholdte sig
- Page 144 and 145: Ligeledes kunne andre typer af de a
- Page 146 and 147: 13 Konklusion Solafskærmningernes
- Page 148 and 149: 14 Praktisk brug af de opnåede res
- Page 150 and 151: Devore, 2000 Devore, Jay L. Probabi
- Page 152 and 153: IEA 21, 1999b Hygge, Staffan; Löfb
- Page 154 and 155: Rosenfeld, 2002 Rosenfeld, Jean Opt
- Page 156 and 157: 15.1 Internetsider www.dmi.dk, 10.1
- Page 158 and 159: Analyse af solafskærmninger mht. t
- Page 160 and 161: iii
- Page 162 and 163: E.4.4 Oversigt over spørgsmål ...
- Page 164: J.4.1 Middelværdier for sammenlign
- Page 167 and 168: A.2 Definitioner Begreb Symbol Besk
- Page 169 and 170: Begreb Symbol Beskrivelse "turbidit
- Page 171 and 172: C Baggrund C.1 Generende reflekser
- Page 173 and 174: Lodrette lameller Danmarks Radio, K
- Page 175 and 176: Indvendig justerbar film Sun-Flex 1
- Page 177 and 178: Figur C.3.b Solafskærmninger der p
- Page 179 and 180: Figur C.3.d Direkte lys guidende sy
- Page 181: Datablade 16
- Page 187 and 188: Systemet til opsamling af lyset bes
- Page 189 and 190: ρ τ prøve prøve λ λ ε ε ε
- Page 191: På nedenstående figur ses max og
- Page 195 and 196: udelukkende indflydelse på større
- Page 197 and 198: En del af solstrålingen, som ramme
- Page 199 and 200: D.2.3 Inputdata til ParaSol I ParaS
- Page 201 and 202: E Forsøg E.1 Soldiagrammer E.1.1 S
- Page 203 and 204: Figur E.1.e Soldiagram for d. 21. m
- Page 205 and 206: vanskeligt at følge med i, hvad de
- Page 207 and 208: Uanset indstillingen er der genspej
- Page 209 and 210: Der forekommer direkte sol på skri
- Page 211 and 212: Kl. 11.40 Kl. 12.40 Kl. 13.40 Kl. 1
- Page 213 and 214: Kl. 15.40 Kl. 15.40 Kl. 15.40 Kl. 1
- Page 215 and 216: E.3.5 Glaslamellerne Der forekommer
- Page 217 and 218: letskyet (II) og halvskyet (III). D
- Page 219 and 220: Spørgsmål Svarmuligheder 5.1 Betr
- Page 221 and 222: Nr. Andre spørgsmål Svarmulighede
- Page 223 and 224: Far too narrow Too narrow Suitable
- Page 241 and 242: E.7 Spørgeskema på engelsk Den en
- Page 259 and 260:
E.8 Statistisk analyse af spørgesk
- Page 261 and 262:
Figur E.8.b Residualplot. De observ
- Page 263 and 264:
title1 'GLM sp2_11'; *** Linear Mod
- Page 265 and 266:
A 4.04167 192 E B 3.25000 192 D C 2
- Page 267 and 268:
For at undgå skyggevirkninger fra
- Page 269 and 270:
undgå utilsigtet belysning (f.eks.
- Page 271 and 272:
For at foretage en kontrol af måli
- Page 273 and 274:
Dagslysfaktoren [%] Dagslysfaktoren
- Page 275 and 276:
Resultater G Karakterisering af sol
- Page 277 and 278:
Ved bølgelængder omkring 300 nm e
- Page 279 and 280:
Absorptans Da reflektansen og trans
- Page 281 and 282:
[-] 1,0 0,9 0,8 0,7 0,6 0,5 0,4 0,3
- Page 283 and 284:
G.1.4 Glaslamellen Reflektans I ned
- Page 285 and 286:
Det bemærkes, at den visuelle tran
- Page 287 and 288:
I de enkelte forsøg viste målinge
- Page 289 and 290:
lamelhældninger. Desuden er også
- Page 291 and 292:
forsøgslokalet. Det skyldes flere
- Page 293 and 294:
g-væ rdi [-] e [-] q i [-] F v [-]
- Page 295 and 296:
Ved en lamelhældning på 45 er lys
- Page 297 and 298:
Punkt Dagslysfaktor [%] Screen Punk
- Page 299 and 300:
H Beskrivelse af måleresultaterne
- Page 301 and 302:
H.1.1 Belysningsstyrke i lokalerne
- Page 303 and 304:
H.1.2 Luminansforhold Luminansmåli
- Page 305 and 306:
Den operative temperatur Den operat
- Page 307 and 308:
forsøget, mens den er faldet til 6
- Page 309 and 310:
klart virke generende og forringer
- Page 311 and 312:
I lokalet med screenen (C) forekom
- Page 313 and 314:
Belysningsstyrke [lux] 80000 70000
- Page 315 and 316:
Belysningsstyrke [lux] 1000 900 800
- Page 317 and 318:
Som i sol med helt lukkede afskærm
- Page 319 and 320:
Operativ temperatur [ C] Dato Scree
- Page 321 and 322:
I.2.1 Figurer af belysningsstyrker
- Page 323 and 324:
Belysningsstyrke [lux] 12000 11000
- Page 325 and 326:
Lokale B Dato: 18. februar Punkt In
- Page 327 and 328:
Lokale E Dato: 19. februar Punkt In
- Page 329 and 330:
Lokale E Dato: 21. februar Punkt In
- Page 331 and 332:
Lokale E Dato: 25. feb. P Indvendig
- Page 333 and 334:
Belysningsstyrke [lux] Belysningsst
- Page 335 and 336:
Belysningsstyrke [lux] Belysningsst
- Page 337 and 338:
Belysningsstyrke [lux] Belysningsst
- Page 339 and 340:
I.4 Luminansmålinger under forsøg
- Page 341 and 342:
24. februar Luminans Papir Punkt 1
- Page 343 and 344:
Luminansforhold [-]] 50 40 30 20 10
- Page 345 and 346:
I.5 Rumtemperatur før og efter for
- Page 347 and 348:
Rumtemperatur [°C] 30 25 20 15 10
- Page 349 and 350:
Belysning (spørgsmål) 1.1 1.4 1.5
- Page 351 and 352:
I lokale C med filmen vurderes nive
- Page 353 and 354:
Figur J.1.e Boks-plot for spørgsm
- Page 355 and 356:
I lokale C med filmen og D med glas
- Page 357 and 358:
Spørgsmål (middelværdi spredning
- Page 359 and 360:
Sol, halvt lukket Lokale E D C A B
- Page 361 and 362:
Spørgsmål Overskyet Sol, helt Sol
- Page 363 and 364:
Spørgsmål A B Sol, halvt lukket C
- Page 365 and 366:
Spørgsmål 2.5.1 Resultater fra Ne
- Page 367 and 368:
Spørgsmål 2.8 2.12 2.12.1 Faktor
- Page 369 and 370:
Spørgsmål 3.2 Hvordan er helhedsi
- Page 371 and 372:
J.4.1 Middelværdier for sammenlign
- Page 373 and 374:
"Vedr. lysforhold på skærm, er de
- Page 375 and 376:
K Beregninger i Desktop Radiance I
- Page 377 and 378:
Der blev oprettet to tekstfiler med
- Page 379 and 380:
Figur K.1.b Model i AutoCad af kont
- Page 381 and 382:
Det ses, at når der anvendes en h
- Page 383 and 384:
kamerasimuleringerne først og frem
- Page 385 and 386:
Belysningsstyrker d. 19. feb. kl. 1
- Page 387 and 388:
331 302 335 123 615 477 629 199 138
- Page 389 and 390:
Figur K.4.e Belysningsstyrker i lok
- Page 391 and 392:
Figur K.4.i Belysningsstyrker i lok
- Page 393 and 394:
Figur K.4.n Belysningsstyrker i lok
- Page 395 and 396:
K.5 Sammenligning af solafskærmnin
- Page 397:
232