<strong>JPMorgan</strong> <strong>Funds</strong> - US Small Cap Growth Fund Wertpapierbestand (in USD) zum 30. Juni 2007 Anzahl/ Nennwert Bezeichnung Marktwert % des Nettovermögens Wertpapiere, die an einer offiziellen Börse gehandelt werden 16.700 Shuffle Master 282.564 0,42 Aktien 55.800 Smith & Wesson Holding Corp 14.050 Sonic 954.124 313.034 1,41 0,46 VEREINIGTE STAATEN VON AMERIKA 23.950 Sourcefire 327.157 0,48 8.900 Acuity Brands 25.650 Adams Respiratory Therapeutics 4.750 Affiliated Managers Group 2.950 Allegheny Technologies 19.800 Allscripts Healthcare Solutions 26.600 American Commercial Lines 38.500 Anadigics 37.200 Ansys 24.950 Arthrocare 20.100 Bancorp 18.300 Bankrate 23.950 Bare Escentuals 15.550 BioMarin Pharmaceuticals 21.800 Blackboard 20.800 Bois d’Arc Energy 23.300 Cbeyond 16.397 Century Aluminum 74.800 Champion Enterprises 548.418 1.016.509 616.217 311.402 508.464 691.866 536.690 995.472 1.104.037 469.938 889.746 821.724 280.988 936.092 356.928 895.652 890.193 751.740 0,81 1,51 0,91 0,46 0,75 1,03 0,80 1,48 1,64 0,70 1,32 1,22 0,42 1,39 0,53 1,33 1,32 1,11 26.500 Switch & Data Facilities Co. 15.250 Syntel 15.100 Taleo - A Shares 17.000 Tessera Technologies 9.250 Theravance 25.750 Thoratec 9.550 Under Armour - A Shares 5.350 United Therapeutics 11.150 Universal Compression Holdings 17.025 Varian Semiconductor Equipment Associates 13.800 Venoco 34.550 VeriFone Holdings 26.600 Viasat 22.250 Viropharma 14.050 WMS Industries 11.900 World Fuel Services 10.300 Wright Express 9.250 WSFS Financial 515.160 480.223 344.733 697.510 312.187 480.753 442.261 342.026 825.212 688.321 255.714 1.228.944 838.964 312.613 410.260 505.869 359.882 605.413 0,76 0,71 0,51 1,03 0,46 0,71 0,65 0,51 1,22 1,02 0,38 1,82 1,24 0,46 0,61 0,75 0,53 0,90 13.150 Chemed 4.600 Chipotle Mexican Grill - A Shares 875.395 391.966 1,30 0,58 63.330.459 93,86 1.000 Covance 25.200 DealerTrack Holdings 14.800 Digital River 12.800 Diodes 23.050 DJO 69.100 947.016 665.852 532.224 956.344 0,10 1,40 0,99 0,79 1,42 BERMUDA 42.750 Castlepoint Holdings 5.350 Orient-Express Hotels - A Shares 25.850 Security Capital Assurance 621.158 284.781 803.418 0,92 0,42 1,19 15.050 Eagle Materials 57.750 Endeavor Acquisition 48.300 Enzo Biochem 31.750 Exelixis 20.250 Formfactor 742.868 661.237 734.160 389.255 780.435 1,10 0,98 1,09 0,58 1,16 KANADA 28.750 Lions Gate Entertainment 42.894 SunOpta 1.709.357 318.838 478.268 2,53 0,47 0,71 21.700 FTD Group 44.100 Gaiam - A Shares 403.403 791.595 0,60 1,17 797.106 1,18 19.000 GameStop - A Shares 21.950 Gartner 12.250 Gaylord Entertainment 763.230 545.896 664.930 1,13 0,81 0,99 IRLAND 15.807 Icon ADR 686.024 1,02 19.100 General Cable 48.550 Gentiva Health Services 13.100 Geo Group 43.100 Globalstar 1.479.295 979.253 380.948 443.930 2,19 1,45 0,56 0,66 BRITISCHE JUNGFERNINSELN 18.100 UTi Worldwide 686.024 506.076 1,02 0,75 16.050 Healthways 21.650 Heico 784.684 923.589 1,16 1,37 506.076 0,75 16.550 Hibbett Sporting Goods 12.850 Hittite Microwave 448.008 553.706 0,66 0,82 Aktien insgesamt 67.029.022 99,34 5.450 Hologic 21.123 Hornbeck Offshore Services 31.050 Iconix Brand Group 305.091 821.685 696.451 0,45 1,22 1,03 Wertpapiere, die an einer offiziellen Börse gehandelt werden, insgesamt 67.029.022 99,34 13.150 Illumina 39.600 Interface - A Shares 542.569 752.400 0,80 1,12 Wertpapierbestand insgesamt 67.029.022 99,34 14.900 Investment Technology Group 64.016 INVESTools 636.230 646.562 0,94 0,96 Bankguthaben 574.784 0,85 23.150 IPG Photonics 26.250 Isilon Systems 466.472 401.887 0,69 0,60 Andere Aktiva und Passiva (130.618) (0,19) 6.629 J Crew Group 24.500 Jamba 350.674 227.360 0,52 0,34 Nettovermögen 67.473.188 100,00 13.620 Kaydon 720.634 1,07 25.750 Keryx Biopharmaceuticals 255.440 0,38 16.750 Kyphon 34.550 Liquidity Services 29.950 LKQ 807.517 650.922 747.851 1,20 0,96 1,11 Aufteilung des Wertpapierbestandes zum 30. Juni 2007 % des Nettovermögens 25.700 Marchex - B Shares 427.391 0,63 Aktien 46.089 Marlin Business Services 14.545 Medivation 978.930 304.863 1,45 0,45 Informationstechnologie Gesundheitswesen 25,45 19,23 12.400 Mentor 16.050 Meridian Bioscience 35.050 Microsemi 13.400 Morningstar 20.950 Myriad Genetics 18.800 Nastech Pharmaceutical 17.500 Nektar Therapeutics 19.350 Neurometrix 33.325 Northstar Neuroscience 507.532 356.150 839.448 645.317 784.787 210.748 170.100 186.147 383.238 0,75 0,53 1,24 0,96 1,16 0,31 0,25 0,28 0,57 Industrie Nicht-Gebrauchsgüter Finanzsektor Energie Rohstoffe Massenkonsumartikel Telekom-Dienstleistungen Aktien insgesamt Bankguthaben und andere Aktiva und Passiva 17,35 15,05 10,30 5,82 2,88 1,93 1,33 99,34 0,66 52.800 Nuance Communications 15.700 Oceaneering International 902.880 833.984 1,34 1,24 Summe 100,00 32.700 Omnicell 684.411 1,01 20.400 Penn Virginia 830.484 1,23 16.550 Polycom 564.521 0,84 17.950 Priceline.com 1.225.983 1,82 5.950 ProAssurance 335.402 0,50 10.950 Psychiatric Solutions 401.975 0,60 47.950 Quiksilver 663.149 0,98 10.050 Red Robin Gourmet Burgers 410.543 0,61 41.800 Resource Capital 599.412 0,89 184 Anzahl/ Nennwert Bezeichnung Marktwert % des Nettovermögens
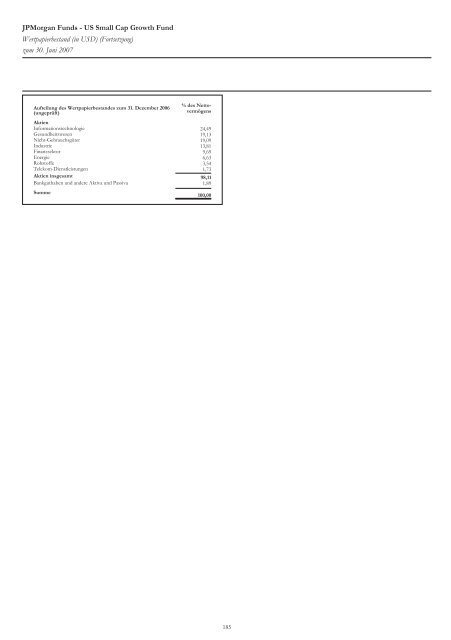
<strong>JPMorgan</strong> <strong>Funds</strong> - US Small Cap Growth Fund Wertpapierbestand (in USD) (Fortsetzung) zum 30. Juni 2007 Anzahl/ Nennwert Bezeichnung Marktwert Aufteilung des Wertpapierbestandes zum 31. Dezember 2006 (ungeprüft) % des Nettovermögens % des Nettovermögens Aktien Informationstechnologie 24,49 Gesundheitswesen 19,13 Nicht-Gebrauchsgüter 19,09 Industrie 13,81 Finanzsektor 9,69 Energie 6,63 Rohstoffe 3,54 Telekom-Dienstleistungen 1,73 Aktien insgesamt 98,11 Bankguthaben und andere Aktiva und Passiva 1,89 Summe 100,00 185 Anzahl/ Nennwert Bezeichnung Marktwert % des Nettovermögens