Reviews in Computational Chemistry Volume 18
Reviews in Computational Chemistry Volume 18
Reviews in Computational Chemistry Volume 18
- No tags were found...

You also want an ePaper? Increase the reach of your titles
YUMPU automatically turns print PDFs into web optimized ePapers that Google loves.
the width/Stokes shift relation (Eq. [101], Figure 9) are <strong>in</strong>dicators of a nonparabolic<br />
form of the CS and CR free energy surfaces. Another <strong>in</strong>dication of<br />
this effect is the energy gap law. The energy gap law refers to the dependence<br />
of the activation energy of a reaction on the difference <strong>in</strong> the Gibbs energy<br />
between the products and reactants. 34,38,50 The Marcus equation, Eq. [9], is<br />
an example of the energy gap law. Experimentally, the energy gap law is monitored<br />
by chang<strong>in</strong>g the gas-phase component of F0 through chemical substitution<br />
of the donor and/or acceptor units. 48 The solvent component of Fi is<br />
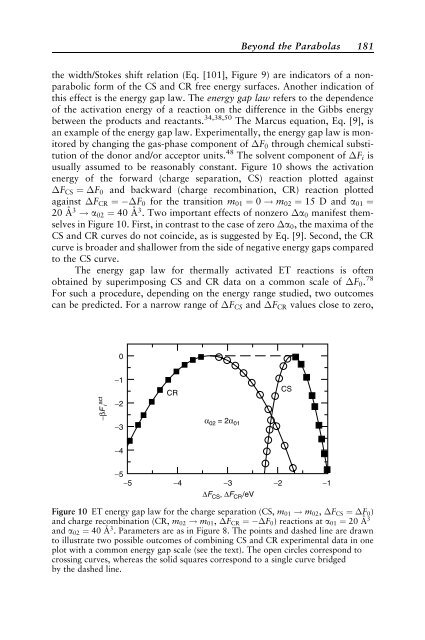
usually assumed to be reasonably constant. Figure 10 shows the activation<br />
energy of the forward (charge separation, CS) reaction plotted aga<strong>in</strong>st<br />
FCS ¼ F0 and backward (charge recomb<strong>in</strong>ation, CR) reaction plotted<br />
aga<strong>in</strong>st FCR ¼ F0 for the transition m01 ¼ 0 ! m02 ¼ 15 D and a01 ¼<br />
20 A ˚ 3 ! a02 ¼ 40 A ˚ 3 . Two important effects of nonzero a0 manifest themselves<br />
<strong>in</strong> Figure 10. First, <strong>in</strong> contrast to the case of zero a0, the maxima of the<br />
CS and CR curves do not co<strong>in</strong>cide, as is suggested by Eq. [9]. Second, the CR<br />
curve is broader and shallower from the side of negative energy gaps compared<br />
to the CS curve.<br />
The energy gap law for thermally activated ET reactions is often<br />
obta<strong>in</strong>ed by superimpos<strong>in</strong>g CS and CR data on a common scale of F0. 78<br />
For such a procedure, depend<strong>in</strong>g on the energy range studied, two outcomes<br />
can be predicted. For a narrow range of FCS and FCR values close to zero,<br />
act<br />
−βF i<br />
0<br />
−1<br />
−2<br />
−3<br />
−4<br />
CR<br />
α 02 = 2α 01<br />
Beyond the Parabolas <strong>18</strong>1<br />
−5<br />
−5 −4 −3<br />
∆FCS , ∆FCR /eV<br />
−2 −1<br />
Figure 10 ET energy gap law for the charge separation (CS, m01 ! m02, FCS ¼ F0)<br />
and charge recomb<strong>in</strong>ation (CR, m02 ! m01, FCR ¼ F0) reactions at a01 ¼ 20 A˚ 3<br />
and a02 ¼ 40 A˚ 3 . Parameters are as <strong>in</strong> Figure 8. The po<strong>in</strong>ts and dashed l<strong>in</strong>e are drawn<br />
to illustrate two possible outcomes of comb<strong>in</strong><strong>in</strong>g CS and CR experimental data <strong>in</strong> one<br />
plot with a common energy gap scale (see the text). The open circles correspond to<br />
cross<strong>in</strong>g curves, whereas the solid squares correspond to a s<strong>in</strong>gle curve bridged<br />
by the dashed l<strong>in</strong>e.<br />
CS