ABSTRACTS / RESUMES - Comitato Glaciologico Italiano
ABSTRACTS / RESUMES - Comitato Glaciologico Italiano
ABSTRACTS / RESUMES - Comitato Glaciologico Italiano

You also want an ePaper? Increase the reach of your titles
YUMPU automatically turns print PDFs into web optimized ePapers that Google loves.
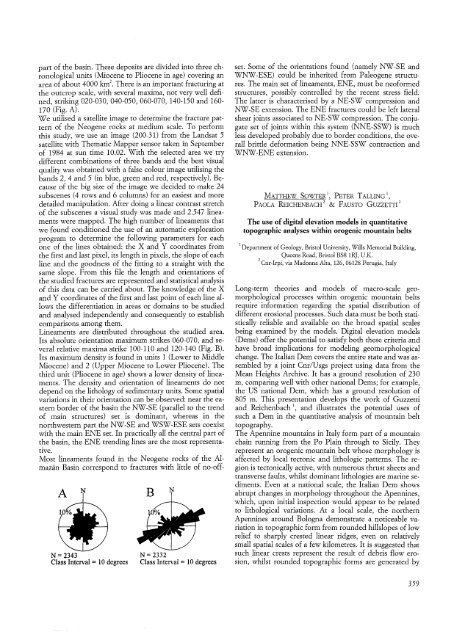
part of the basin. These deposits are divided into three chronological<br />
units (Miocene to Pliocene in age) covering an<br />
area of about 4000 km'. There is an important fracturing at<br />
the outcrop scale, with several maxima, not very well defined,<br />
striking 020-030, 040-050, 060-070, 140-150 and 160<br />
170 (Fig. A).<br />
We utilised a satellite image to determine the fracture pattern<br />
of the Neogene rocks at medium scale. To perform<br />
this study, we use an image (200-31) from the Landsat 5<br />
satellite with Thematic Mapper sensor taken in September<br />
of 1984 at sun time 10.02. With the selected area we try<br />
different combinations of three bands and the best visual<br />
quality was obtained with a false colour image utilising the<br />
bands 2,4 and 5 (in blue, green and red, respectively). Because<br />
of the big size of the image we decided to make 24<br />
subscenes (4 rows and 6 columns) for an easiest and more<br />
detailed manipulation. After doing a linear contrast stretch<br />
of the subscenes a visual study was made and 2.547 lineaments<br />
were mapped. The high number of lineaments that<br />
we found conditioned the use of an automatic exploration<br />
program to determine the following parameters for each<br />
one of the lines obtained: the X and Y coordinates from<br />
the first and last pixel, its length in pixels, the slope of each<br />
line and the goodness of the fitting to a straight with the<br />
same slope. From this file the length and orientations of<br />
the studied fractures are represented and statistical analysis<br />
of this data can be carried about. The knowledge of the X<br />
and Y coordinates of the first and last point of each line allows<br />
the differentiation in areas or domains to be studied<br />
and analysed independently and consequently to establish<br />
comparisons among them.<br />
Lineaments are distributed throughout the studied area.<br />
Its absolute orientation maximum strikes 060-070, and several<br />
relative maxima strike 100-110 and 120-140 (Fig. B).<br />
Its maximum density is found in units 1 (Lower to Middle<br />
Miocene) and 2 (Upper Miocene to Lower Pliocene). The<br />
third unit (Pliocene in age) shows a lower density of lineaments.<br />
The density and orientation of lineaments do not<br />
depend on the lithology of sedimentary units. Some spatial<br />
variations in their orientation can be observed: near the eastern<br />
border of the basin the NW-SE (parallel to the trend<br />
of main structures) set is dominant, whereas in the<br />
northwestern part the NW-SE and WSW-ESE sets coexist<br />
with the main ENE set. In practically all the central part of<br />
the basin, the ENE trending lines are the most representative.<br />
Most lineaments found in the Neogene rocks of the Almazan<br />
Basin correspond to fractures with little of no-off-<br />
N<br />
N= 2343<br />
ClassInterval = 10 degrees<br />
N = 2332<br />
Class Interval= 10 degrees<br />
set. Some of the orientations found (namely NW-SE and<br />
WNW-ESE) could be inherited from Paleogene structures.<br />
The main set of lineaments, ENE, must be neoformed<br />
structures, possibly controlled by the recent stress field.<br />
The latter is characterised by a NE-SW compression and<br />
NW-SE extension. The ENE fractures could be left lateral<br />
shear joints associated to NE-SW compression. The conjugate<br />
set of joints within this system (NNE-SSW) is much<br />
less developed probably due to border conditions, the overall<br />
brittle deformation being NNE-SSW contraction and<br />
WNW-ENE extension.<br />
MATTHEW SOWTER 1, PETER TALLING 1,<br />
PAOLA REICHENBACH 2 & FAUSTO GUZZETTI 2<br />
. The use of digital elevation models in quantitative<br />
topographic analyses within orogenic mountain belts<br />
1 Department of Geology, Bristol University, Wills Memorial Building,<br />
Queens Road, Bristol BS8 1R], U.K.<br />
2 Cnr-Irpi, via Madonna Alta, 126, 06128 Perugia, Italy<br />
Long-term theories and models of macro-scale geomorphological<br />
processes within orogenic mountain belts<br />
require information regarding the spatial distribution of<br />
different erosional processes. Such data must be both statistically<br />
reliable and available on the broad spatial scales<br />
being examined by the models. Digital elevation models<br />
(Derris) offer the potential to satisfy both these criteria and<br />
have broad implications for modeling geomorphological<br />
change. The Italian Dem covers the entire state and was assembled<br />
by a joint Cnr/Usgs project using data from the<br />
Mean Heights Archive. It has a ground resolution of 230<br />
m, comparing well with other national Dems; for example,<br />
the US national Dem, which has a ground resolution of<br />
805 m. This presentation develops the work of Guzzetti<br />
and Reichenbach 1, and illustrates the potential uses of<br />
such a Dem in the quantitative analysis of mountain belt<br />
topography.<br />
The Apennine mountains in Italy form part of a mountain<br />
chain running from the Po Plain through to Sicily. They<br />
represent an orogenic mountain belt whose morphology is<br />
affected by local tectonic and lithologic patterns. The region<br />
is tectonically active, with numerous thrust sheets and<br />
transverse faults, whilst dominant lithologies are marine sediments.<br />
Even at a national scale, the Italian Dem shows<br />
abrupt changes in morphology throughout the Apennines,<br />
which, upon initial inspection would appear to be related<br />
to lithological variations. At a local scale, the northern<br />
Apennines around Bologna demonstrate a noticeable variation<br />
in topographic form from rounded hillslopes of low<br />
relief to sharply crested linear ridges, even on relatively<br />
small spatial scales of a few kilometres. It is suggested that<br />
such linear crests represent the result of debris flow erosion,<br />
whilst rounded topographic forms are generated by<br />
359